Core & Statewide Supply Reports 24-25
View Prior Reports
November 3, 2025
Core Supply Dashboard
Water Year in Review:
Each water year tells its own story, and this year was no exception. Read on to see the final outcome.
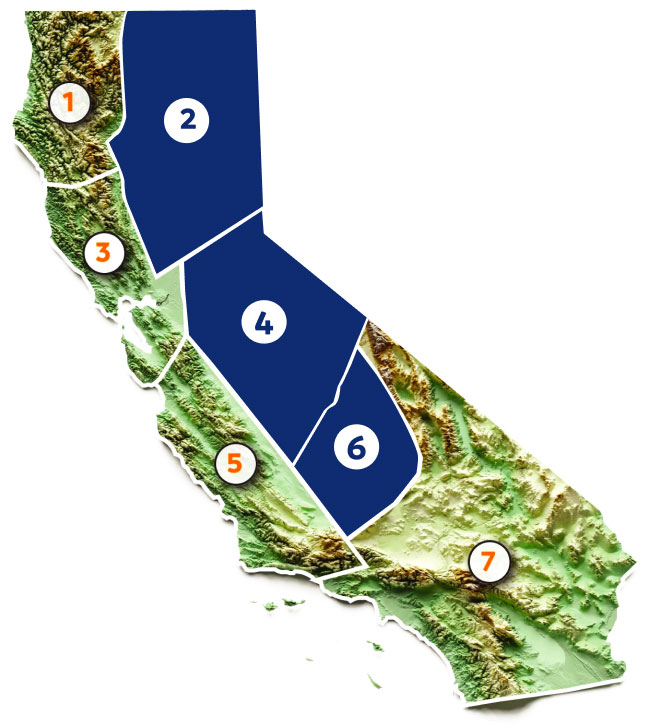
Because of data availability issues with the NWS feed we typically use, we have made some adjustments to our verification framework for this report. For statewide precipitation totals, we have utilized California Water Watch estimates. Year-end totals for the Core Supply are estimated using station data from the regional precipitation indices produced by the California-Nevada River Forecast Center (CNRFC): the 8 stations comprising the Northern Sierra represent our CAP Region 2, the 5 stations of the San Joaquin Basin represent our CAP Region 4, and the 6 stations of the Tulare Basin represent our CAP Region 6.
Since publication of our previous report at the end of the wet season, we have gained roughly 6 percentage points in the Core Supply region to end the water year at ~95% of normal. Dive into the Insights section (left sidebar menu) for a more in-depth look at the water year.
The dashboard below shows the Core Supply status (Regions 2, 4, and 6) through September 30.
Core Supply:
CAP Forecast WY 2024-25


Core Supply: Year-over-Year Comparison


Highlights
- After a slow start, late-December storms delivered nearly 10 inches of precipitation to the Core Supply region, increasing water year progress by 19 percentage points.
- December Core Supply precipitation totaled 9.73 inches — well above the climatological December average of 7 inches — and bringing the observed precipitation to 44.86% of water-year average.
- This two-week surge in precipitation pushed the current water year past the early-season totals of analog years 2018–19 and 2024–25. See the Insights Section for more on this year’s precipitation.
- Observed reservoir inflows through December 31, 2025 are available in the CRAFT section of the portal while the Insights section highlights Lake Shasta and Lake Oroville, comparing inflow forecasts alongside observed values.
View Prior Reports
November 3, 2025
Statewide Dashboard
Water Year in Review:
Each water year tells its own story, and this year was no exception. Read on to see the final outcome.
Because of data availability issues with the NWS feed we typically use, we have made some adjustments to our verification framework for this report. For statewide precipitation totals, we have utilized California Water Watch estimates. Year-end totals for the Core Supply are estimated using station data from the regional precipitation indices produced by the California-Nevada River Forecast Center (CNRFC): the 8 stations comprising the Northern Sierra represent our CAP Region 2, the 5 stations of the San Joaquin Basin represent our CAP Region 4, and the 6 stations of the Tulare Basin represent our CAP Region 6.
Since publication of our previous report at the end of the wet season, the State has gained roughly 9 percentage points to end the water year at ~96% of normal. Dive into the Insights section (left sidebar menu) for a more in-depth look at the water year.
The dashboard below shows the state as a whole through September 30.

Statewide:
CAP Forecast WY 2024-25

Highlights
- The state gained 9 percentage points since April, bringing the WY total to 96% of average and within CAP’s forecasted range for the ninth consecutive year.
- At the close of the water year, analog years 2017-18 and 2018-19 have proven to be a good guide as precipitation accumulation for WY 2425 remains between the analog traces.
CAP: Regional Reports 24-25
Region 2: Sacramento, Feather, & American
View Prior Reports
As a reminder, because of the NWS data gaps, we are now utilizing the Northern Sierra 8-station index data for observed precipitation totals and to compute Region 2 averages.
For Region 2 (Sacramento, Yuba, Feather, and American), 90-110% of normal equates to 47.85 to 58.49”. This region gained 2.51” of precipitation since May 1. Through the end of the water year, Region 2 has received 56.55”, representing 106% of WY normal – and within the CAP forecast range.

Region 4: San Joaquin & Tulare
View Prior Reports
As a reminder, because of the NWS data gaps, we are now utilizing the San Joaquin 5-station index data for observed precipitation totals and to compute Region 4 averages.
For Region 4 (San Joaquin and Tulare) 90-110% of normal equates to 35.95-43.93”. This region gained 2.08” from May-September 30 for a WY total of 32.6”, representing 82% of WY normal- and 8 percentage points shy of the CAP forecast range.

Region 6: Kern & Kings
View Prior Reports
As a reminder, because of the NWS data gaps, we are now utilizing the Tulare Basin 6-station index data for observed precipitation and to compute Region 6 averages.
For Region 6 (Kern and Kings) 90-110% of normal equates to 25.48-31.14”. This region gained 1.54” of precipitation from May-September 30. At the close of the water year, the total precipitation was 23.01,” representing 81% of WY normal- and 9 percentage points shy of the CAP forecast range.

CRAFT | Reservoir Inflow Forecast
Water Year 2024-25 With Observed Data through 9/30/2025


