March 3, 2025
Core Supply Dashboard
January in Review
In the fourth month of the water year, the Core Supply region gained a mere 0.99 inches of precipitation, adding ~5 percentage points to the total WY accumulation. Dive into the Insights section (left sidebar menu) to better understand just how dry January was and what lies ahead- including updates on our R&D efforts.
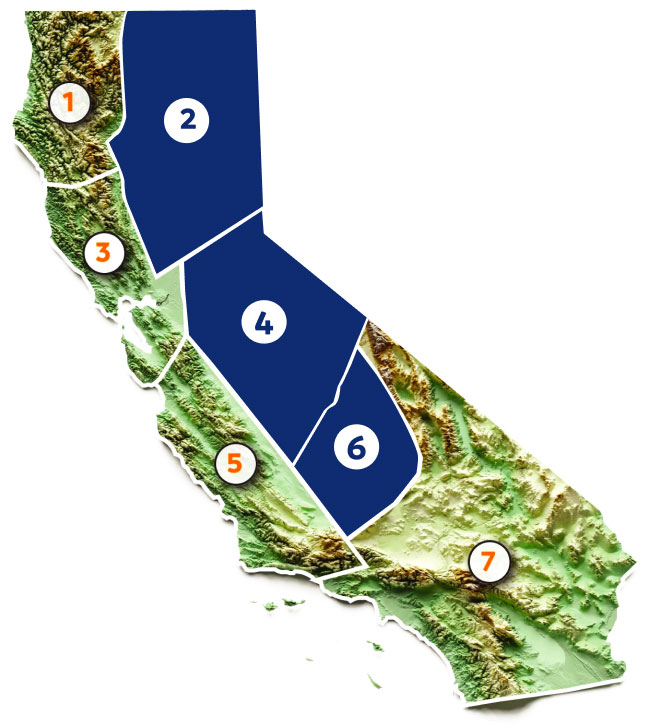
The dashboard below shows the Core Supply status (Regions 2, 4, and 6) with National Weather Service data through January 31.
Core Supply:
CAP Forecast WY 2024-25

Core Supply:
Year-over-Year Comparison


Highlights
- The Core Supply region added only 0.99” to its WY accumulation in the month of January, bringing the WY to 41.37% of normal.
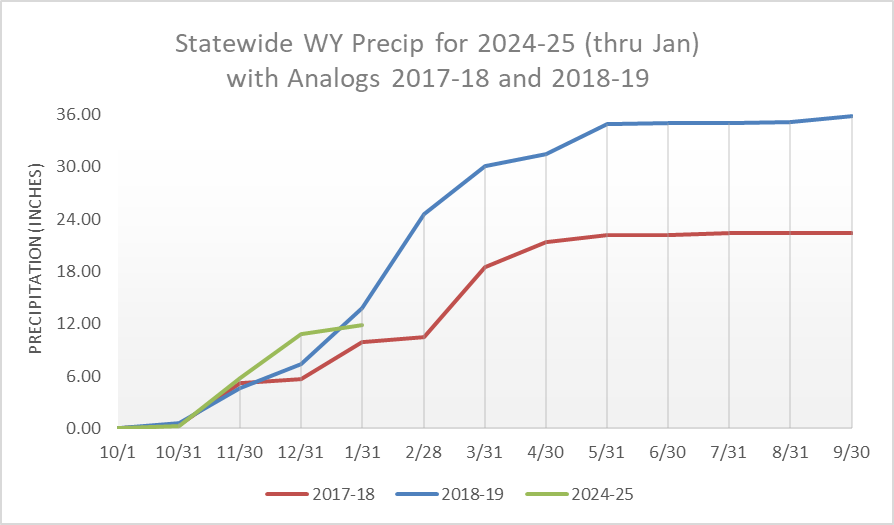
- Accumulated precipitation remains close to the analog years of 2017-18 and 2018-19. The plot below shows the Statewide precipitation for the current water year (11.82” through the end of January), now sitting between the totals for 2017-18 and 2018-19 (with 9.85” and 13.83”, respectively, through January).