December 23, 2024
Core Supply Dashboard
WY 2024-25 Precipitation Forecast: 90-110% of normal
Following a slightly below normal water year in 2023-24, California will be looking ‘average’ in water year 2024-25. The California Annual Precipitation (CAP) forecast indicates water year precipitation will be 90-110% of normal.
The dashboard below shows the Core Supply status (Regions 2, 4, and 6) with National Weather Service data through November 30. You will recall from the forecast release that the NWS precipitation data acquisition/quality control process can take several weeks, so the dashboard below does not include any December precipitation data.
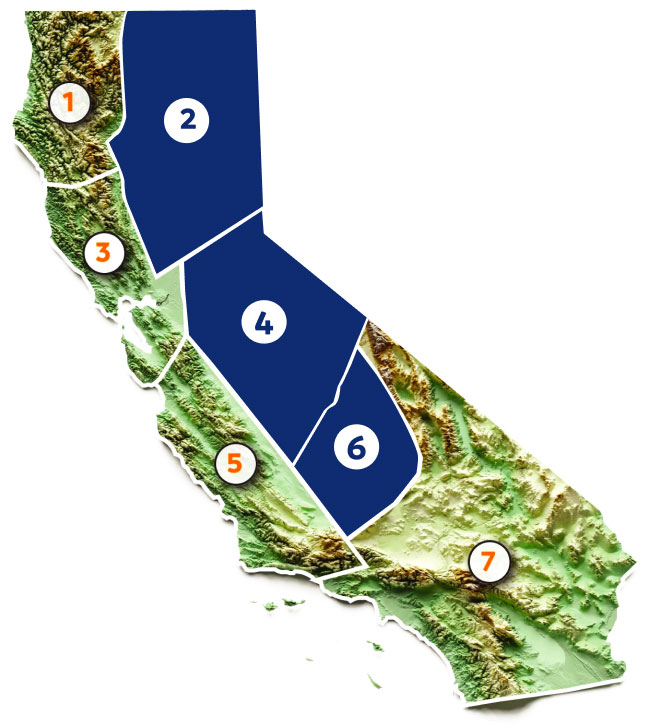
Core Supply:
CAP Forecast WY 2024-25

Core Supply:
Year-over-Year Comparison


Highlights
- November was an active month with two successive atmospheric rivers bringing significant precipitation to California
- The first event primarily impacted Northern California, with the greatest effects observed in the North Bay area. While precipitation was concentrated in CAP Regions 1, 2, and 3, the Core Supply (Regions 2, 4, and 6) added nearly 15 percentage points of total water year accumulation.
- The second event, occurring from November 25–27, mainly impacted CAP Region 6. This resulted in a more modest gain of approximately 12 percentage points for Region 6 and only 5 percentage points for the Core Supply.
- Accumulated precipitation continues to closely follow the accumulation curves of analog years 2017-18 and 2018-19. However, through November, the Northern Sierra 8-Station Index shows current water year accumulations slightly exceeding analogs, thanks to the recent atmospheric river activity. This is hardly surprising, given that November's 8-station accumulation reached 254% of normal—13.5” compared to the 5.3” average.
- See the Insights section for more discussion about the where/when/how of this year’s precipitation.
