January 31, 2025
Core Supply Dashboard
December in Review: Trends, Tools, and What’s Next
In the third month of the water year, the Core Supply region gained 5.73 inches of precipitation, adding 16 percentage points to the total WY accumulation. There’s a lot to unpack—comparing analog water years to the current year, discussing Southern California’s dry start, and looking forward to what lies ahead. Dive into the Insights section (left sidebar menu) for the details.
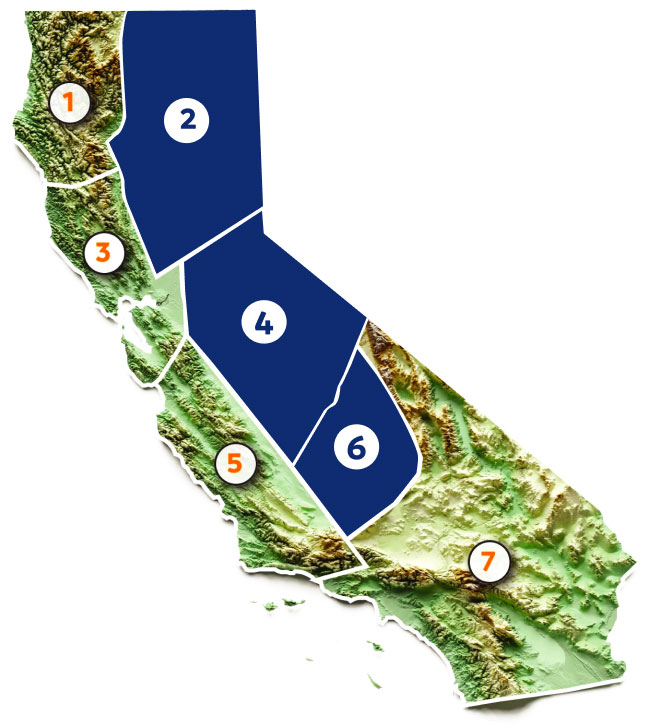
The dashboard below shows the Core Supply status (Regions 2, 4, and 6) with National Weather Service data through December 31.
Core Supply:
CAP Forecast WY 2024-25

Core Supply:
Year-over-Year Comparison


Highlights
- The Core Supply region added 5.73” to its WY accumulation in the month of December, nearly matching November’s accumulation of 6.3”. This brings the WY to 36.19% of normal, leaving 53.81 percentage points to reach the lower end of the CAP forecast range.
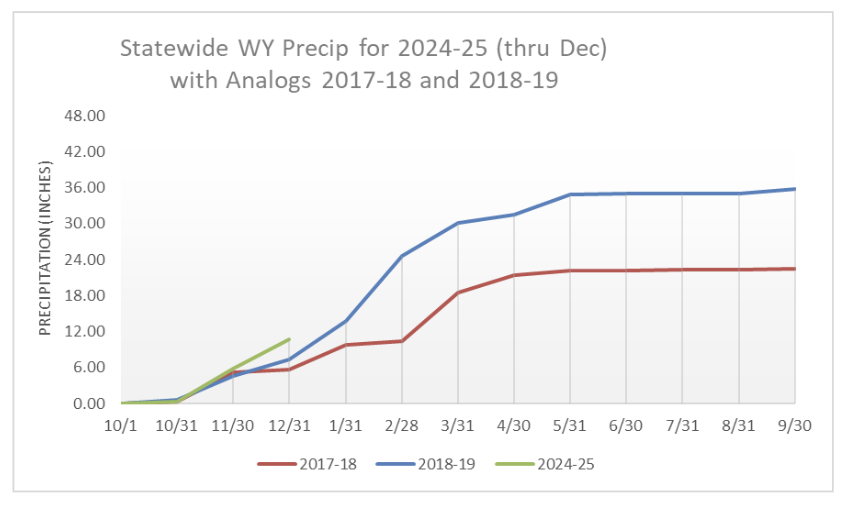
- Accumulated precipitation remains close to the analog years of 2017-18 and 2018-19. The plot below shows the Statewide precipitation for the current water year (10.69” through the end of December), exceeding the totals for both 2017-18 and 2018-19 (with 5.62” and 7.33”, respectively, through December). However, the latest traces of the 8-, 5- and 6-station indices (highlighted in the Insights section) show that precipitation has nearly flatlined in January and we will likely see that the current water year is between the two analogs with next month’s report.
- The late December precipitation event (Dec 20-29) ushered precipitation predominately into the northern parts of the state.
- In our ad hoc event report, the event was credited with 9.10 percentage points of precipitation for the Core Supply region, bringing the total WY accumulation to roughly 37% of WY normal. The official NWS data for December shows the Core Supply sits at 36.19% of WY normal, impressively close to the estimates from the ad hoc event report.
