June 4, 2026
Region 2: Sacramento, Yuba, Feather & American
Reservoirs
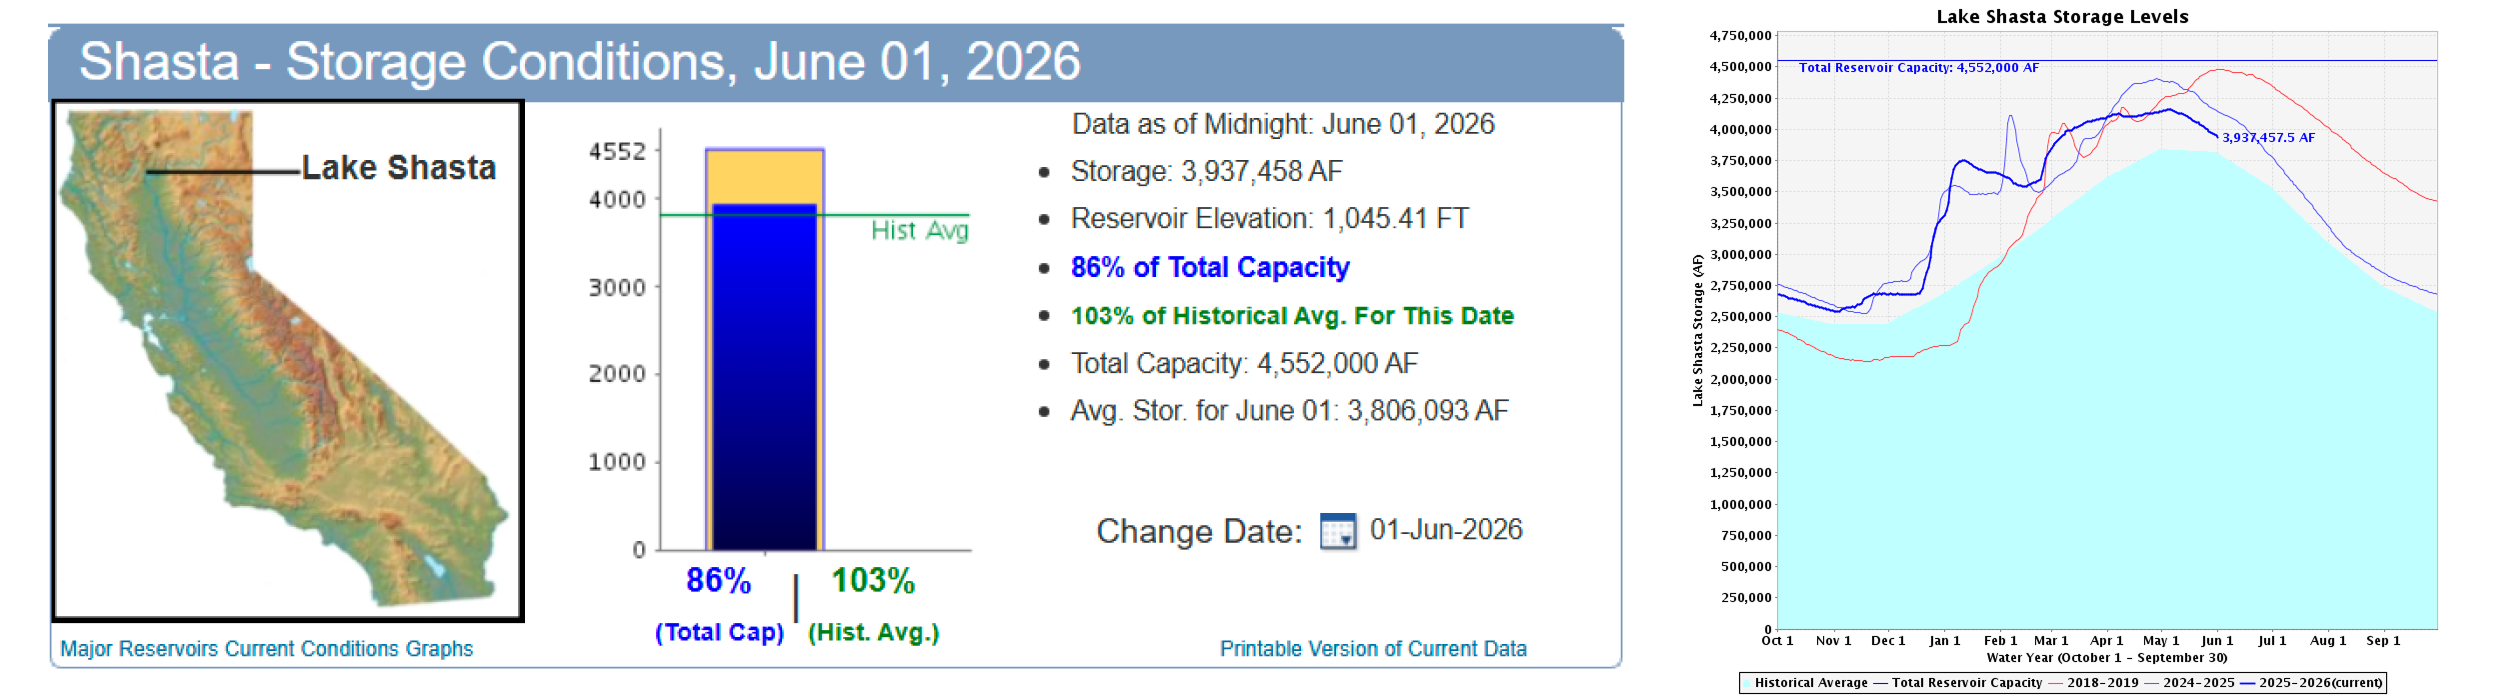
The Region 2 reservoir update focuses on Lake Shasta and Lake Oroville. A snapshot of current storage conditions from the Department of Water Resources is included for each reservoir. Below that, storage levels for the current water year (dark blue) are shown alongside analog years (2018–19 and 2024–25) for context.

Precipitation
As with the Core Supply, regional precipitation is presented using both the corrected NWS data feed and GG Weather values, offering a comprehensive perspective on how precipitation has been distributed across the region. The NWS stations reflect higher-elevation, basin-oriented conditions most relevant to water supply, while GG Weather values represent valley- and coastal-based observations.
CAP model output indicates that Region 2 will receive 105-125% of normal precipitation. Region 2 totals are broadly consistent between datasets, with 95.3% (NWS) and 97.3% (GG Weather) of average. The close agreement suggests precipitation has been relatively well distributed across both valley and higher-elevation locations in Northern California.
NWS data indicates that Region 2 saw 1.5 inches of precipitation during the month of May, adding just over 4 percentage points to the accumulation.