January 2026
Sacramento, Yuba, Feather & American
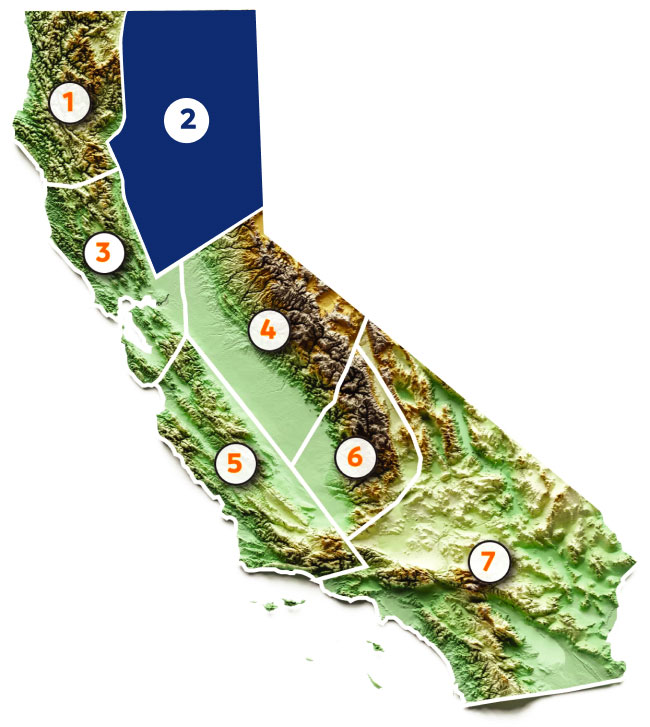
CAP model output indicates that Region 2 will receive 105-125% of normal precipitation. For Region 2, 105-125% of normal equates to 55.83-66.46”.
The regional gauge below shows the CAP forecast lower and upper bounds (55.83-66.46”), the “normal” for Region 2, and the observed precipitation through the end of December. With another boost from the recent atmospheric river activity, this region recorded an impressive 15.6 inches of accumulation in December and sits at 49.46% of total water year precipitation, marking an increase of nearly 30 percentage points over the past couple weeks.
Region 2 has typically received 18.7 inches by this point in the water year; with 26.3 inches currently recorded, the region is running well above average.
The NWS data feed we typically use for verification has been permanently discontinued due to federal funding issues so we have made some adjustments to our verification framework. Estimates for water year averages are calculated using station data from the regional precipitation indices produced by the California-Nevada River Forecast Center (CNRFC): the 8 stations comprising the Northern Sierra represent our CAP Region 2, the 5 stations of the San Joaquin Basin represent our CAP Region 4, and the 6 stations of the Tulare Basin represent our CAP Region 6.
Sacramento, Yuba, Feather & American

