March 28, 2025
Region 2: Sacramento, Yuba, Feather & American
The CAP forecast is valid for the state of California. However, we can estimate regional precipitation forecasts by applying the statewide forecast (90-110% of normal) to the regional precipitation averages. For Region 2 (Sacramento, Yuba, Feather, and American), 90-110% of normal equates to 41.09” to 50.22”. After a dry January, Region 2 received 12.58” in February for a WY accumulation of 35.35”, an increase of nearly 28 percentage points.
If we consider the precipitation distribution for the state, we find that- once again- 97% of stations in Region 2 fall on the “wet” side of the distribution. The average % increase for February across all 30 reporting stations was 27.58%; for context, the median for the 114 reporting stations across the state was 23.29%. The standout station in this region was Canyon Dam, gaining 37.8% in February.
How many stations are close to CAP’s verification range of 90-110%? If we consider a threshold of 80% WY accumulation or greater, 12 stations in Region 2 have already exceeded 80% accumulation. Furthermore, 5 are within the CAP forecast range considering data through the end of February.
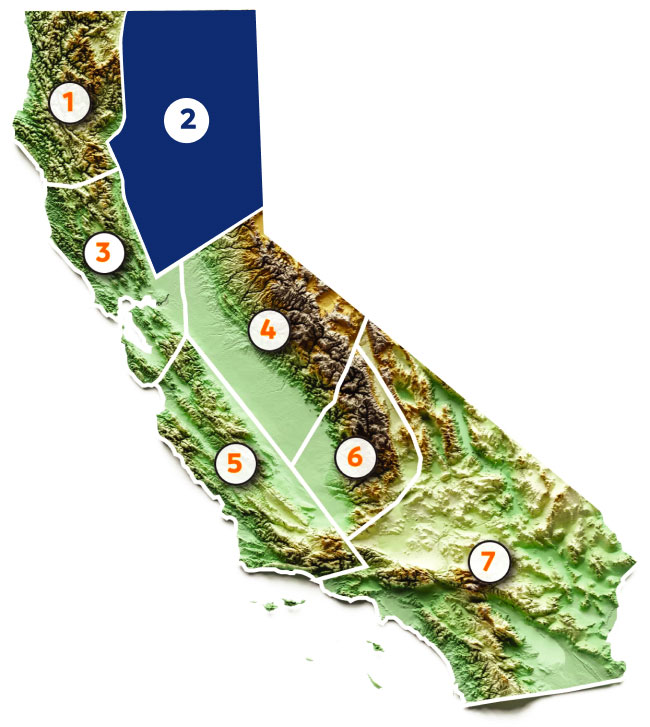
Sacramento, Yuba, Feather & American

