January 31, 2025
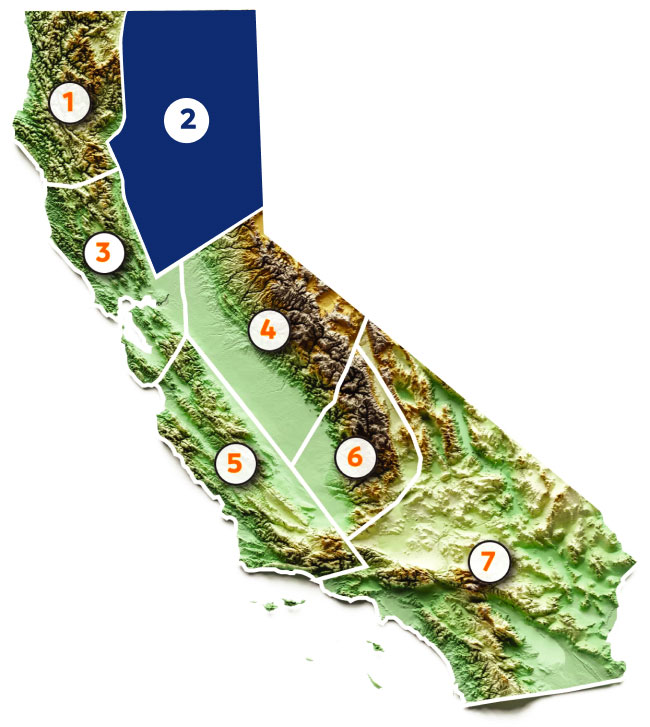
Region 2: Sacramento, Feather, & American
The CAP forecast is valid for the state of California. However, we can estimate regional precipitation forecasts by applying the statewide forecast (90-110% of normal) to the regional precipitation averages. For Region 2 (Sacramento, Feather, and American), 90-110% of normal equates to 41.09” to 50.22”. This region had back-to-back months of over 10 inches of accumulation, receiving 10.14” in December for a WY accumulation of 21.38”. This brought Region 2 from 24.8% to 46.8% of WY normal.
If we consider the precipitation distribution for the state, we find that- once again- 97% of stations in Region 2 fall on the “wet” side of the distribution. Given the precipitation events in both November and December, this comes as no surprise. The average WY accumulation for the 32 reporting stations is 46.8%. Shasta Dam saw an impressive 19.03” of precipitation in December, accounting for 29% of its water year normal, bringing that station to 54% for the year. The Davis Experimental Farm station gained 7.45” – representing 38% of its WY normal and bringing that station to 58% of normal for the water year.
Sacramento, Yuba, Feather & American

