December 23, 2024
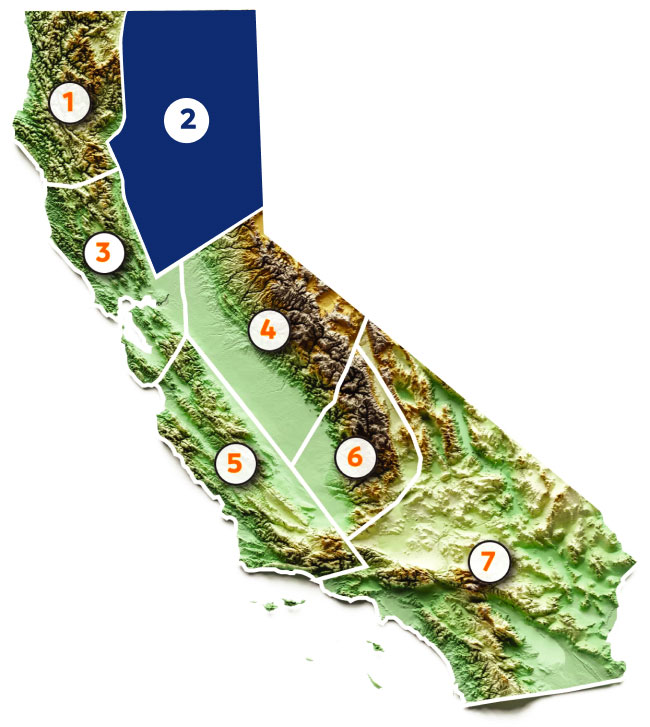
Region 2: Sacramento, Feather, & American
The CAP forecast is valid for the state of California. However, we can estimate regional precipitation forecasts by applying the statewide forecast (90-110% of normal) to the regional precipitation averages. For Region 2 (Sacramento, Feather, and American), 90-110% of normal equates to 40.82” to 49.89”. This region saw a phenomenal jump in November, receiving 10.56” to reach an accumulation of 11.24” and going from 1.5% to 24.8% of WY normal!
If we consider the precipitation distribution for the state, we find that 97% of stations in Region 2 fall at the median or on the “wet” side of the distribution. This comes as no surprise, given the significance of the first atmospheric river event for Region 2. The average WY accumulation for the 32 reporting stations is 25.8%. Quincy saw an impressive 16.16” of precipitation in November, accounting for 43% of its total water year accumulation. This pattern is reflected in the precipitation map within the Insights section.
Sacramento, Yuba, Feather & American

