November 19, 2024
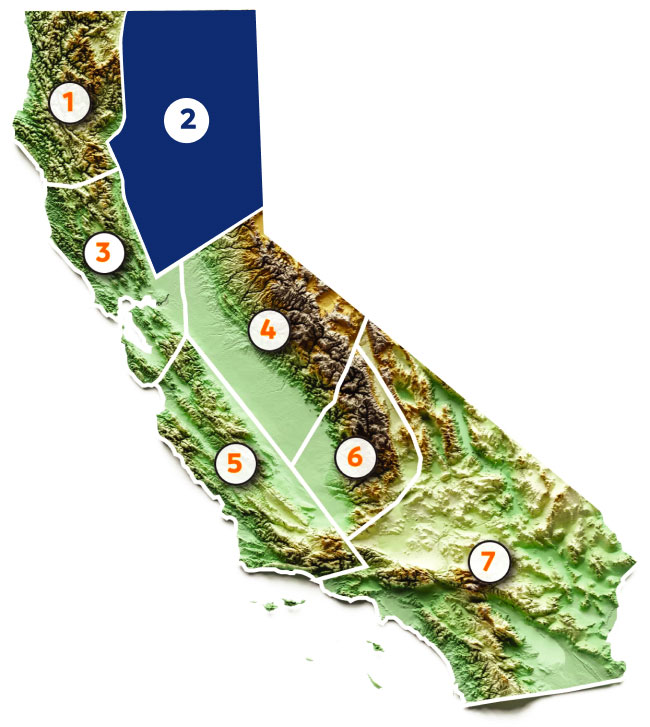
Region 2: Sacramento, Feather, & American
The CAP forecast is valid for the state of California. However, we can estimate regional precipitation forecasts by applying the statewide forecast (90-110% of normal) to the regional precipitation averages. For Region 2 (Sacramento, Feather, and American), 90-110% of normal equates to 40.10” to 49.01”. This region has received a mere 0.68” (1.5% of WY normal) during the month of October.
In future monthly updates, as precipitation totals become more significant, we will leverage our NWS station analysis tool to provide deeper regional insights. This tool enables us to define precipitation thresholds of interest and answer key questions such as: How many stations have received a specific percentage of their annual precipitation? Which stations fall within the forecast bounds? Is this region trending on the wet or dry side of the precipitation distribution? These analyses will help us track and communicate the evolving story of regional precipitation patterns.
Although we are only one month into the water year, if we consider the precipitation distribution for the state, we find that 78% of Region 2 stations fall at the median or on the “wet” side. This pattern is reflected in the precipitation map within the Insights section.
Sacramento, Yuba, Feather & American

