March 3, 2025
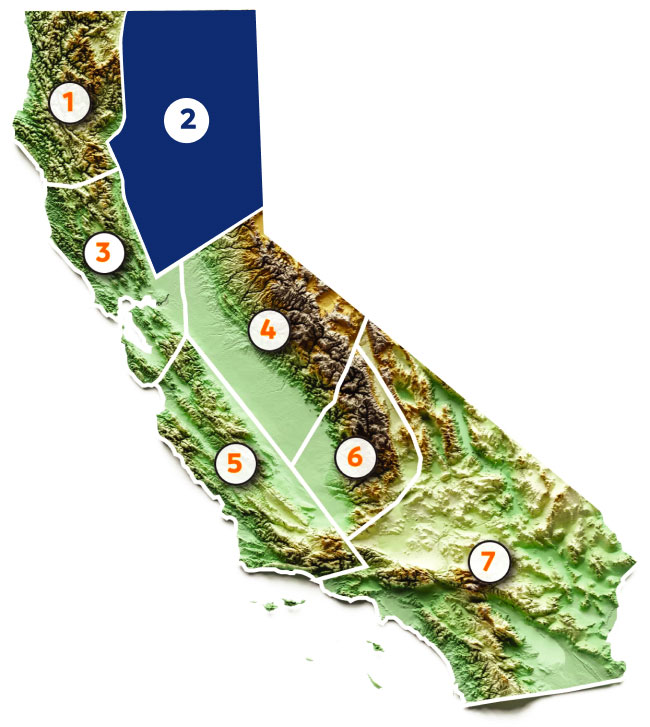
Region 2: Sacramento, Yuba, Feather & American
The CAP forecast is valid for the state of California. However, we can estimate regional precipitation forecasts by applying the statewide forecast (90-110% of normal) to the regional precipitation averages. For Region 2 (Sacramento, Feather, and American), 90-110% of normal equates to 41.09” to 50.22”. After back-to-back months of over 10 inches of accumulation, Region 2 received a mere 1.35” in January for a WY accumulation of 22.73”, an increase of just 3 percentage points.
If we consider the precipitation distribution for the state, we find that- once again- 97% of stations in Region 2 fall on the “wet” side of the distribution. However, this distinction is less about what happened in January and more about what happened in the months prior. The average % increase for January across all 30 reporting stations was only 3.07%; for context, the median for the 114 reporting stations across the state was 2.62%. The standout station in this region was Adin, gaining 7.3% for the month. This pales in comparison to last month’s standout (Davis Experimental Farm station) who saw an impressive 38% increase.
A Note about Core Water:
We are always exploring new ways to analyze the data. To better understand precipitation patterns, we examined accumulation percentages across all stations and divided them into quartiles—four equal groups that rank stations from driest (Q1) to wettest (Q4). Comparing “Core Water” (Regions 2/4/6) and “Non-Core Water” stations, we see a clear contrast: Core Water stations tend to be wetter, with most falling in Q3 or Q4 and only 3 of 61 in Q1. In contrast, nearly half of Non-Core Water stations are in Q1, highlighting a much drier distribution.

Sacramento, Yuba, Feather & American

