June 4, 2026
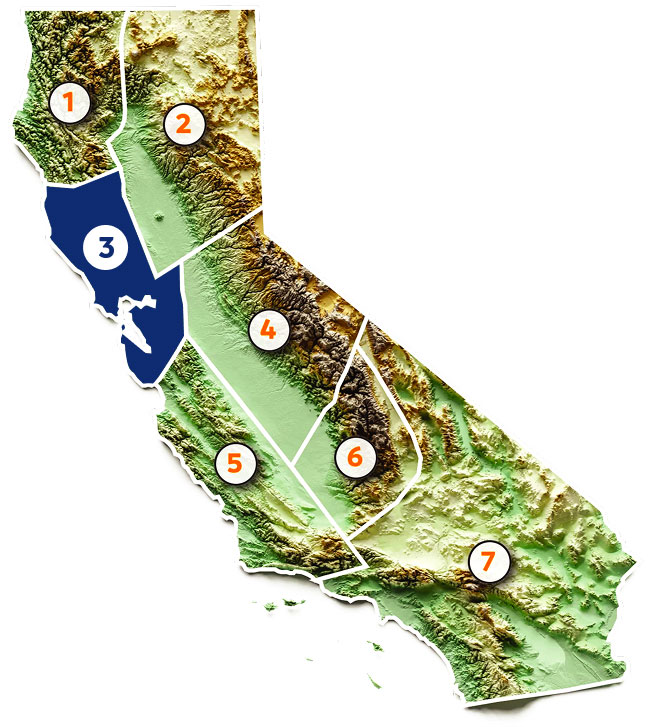
Region 3: Russian, Napa, & San Francisco Bay
Precipitation
As with the Core Supply, regional precipitation is presented using both the corrected NWS data feed and GG Weather values, offering a comprehensive perspective on how precipitation has been distributed across the region. The NWS stations reflect higher-elevation, basin-oriented conditions most relevant to water supply, while GG Weather values represent valley- and coastal-based observations.
CAP model output indicates that Region 3 will receive 100-120% of normal precipitation. Region 3 shows the largest divergence between datasets, with totals ranging from 89.5% (NWS) to 105.5% (GG Weather) of average. This reflects the strong influence of coastal and valley precipitation this season, where storm systems tracked into the North-Central coast before progressing inland. As a result, lower-elevation locations (including the Bay Area and Central Coast) have received substantially more precipitation than inland and elevation-influenced stations. For coastal and valley-based operations, the GG values may provide a more representative picture of current conditions.
NWS data indicates that Region 3 saw 0.4 inches of precipitation during the month of May, adding ~2 percentage points to the accumulation.