April 2026
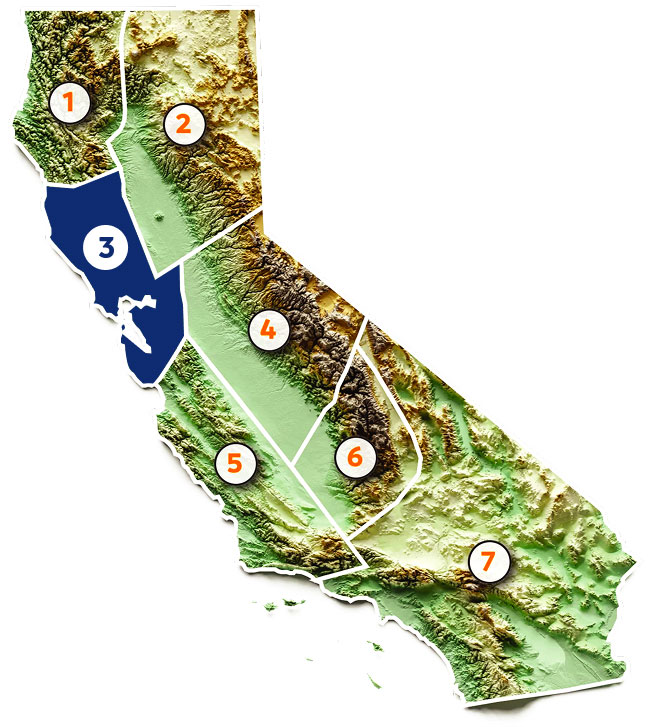
Region 3: Russian, Napa, & San Francisco Bay
CAP model output indicates that Region 3 will receive 100-120% of normal precipitation. For Region 3, 100-120% of normal equates to 22.84-27.41”.
The regional gauge below shows the CAP forecast lower and upper bounds (22.84-27.41”), the “normal” for Region 3, and the observed precipitation through April 6. In March, Region 3 received only 0.02 inches of precipitation, while the start of April has proven far more productive with 0.44 inches in the first few days. From March 1 to April 6, Region 3 has gained a total of 0.46 inches, representing a very modest increase of 2 percentage points. This brings Region 3 to 93.2% of water year normal.
PLEASE NOTE: Water-year averages and accumulations are calculated using the California–Nevada River Forecast Center (CNRFC) monthly precipitation observations, which provide station-level precipitation totals across valley floor, foothill, and mountain locations. These observations are sourced directly from the National Weather Service CNRFC precipitation monitoring dataset and are used to derive regional water-year accumulations and percentages of normal for each CAP region.
Russian, Napa, & San Francisco Bay

