February 3, 2026
Core Supply Dashboard
WY 2025-26 Precipitation Forecast: Above Normal, Decreasing to the South
Following an “average” year in 2024-25, it looks like much of California will have a chance of experiencing above average precipitation in water year 2025-26, with a modest drying gradient to the south. Refer to the Insights Section for more details (left sidebar).
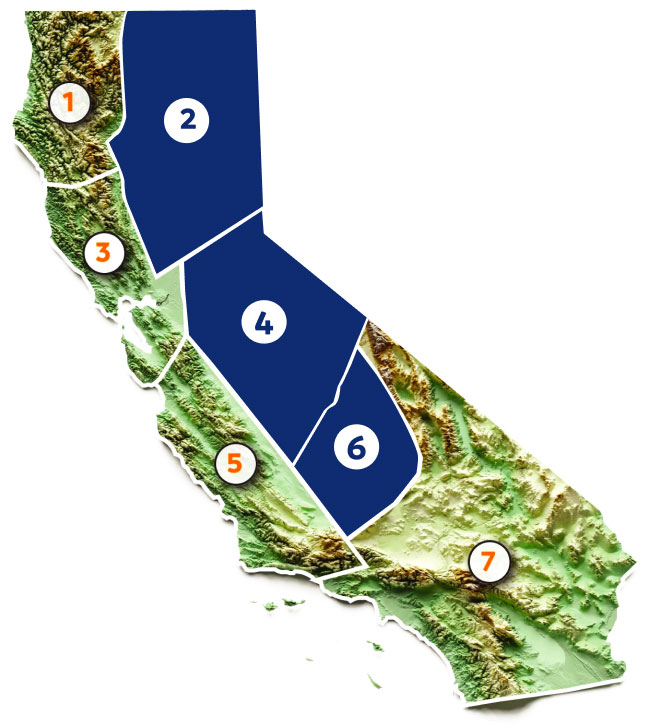
The dashboard below shows the Core Supply status (Regions 2, 4, and 6, shaded orange) with observed data through January 31, 2026.
For details by region, see the Regional section below.
Core Supply:
CAP Forecast WY 2024-25

Core Supply:
Year-over-Year Comparison


Highlights
- January’s accumulation was roughly half of December’s, with the Core Supply region gaining 5.41 inches of precipitation, increasing water year progress by roughly 13 percentage points. This is just below the historical average for January (7.59 inches).
- With a total water year accumulation of 24.17 inches, the Core Supply sits at 57.78% of water-year average.
- With more modest precipitation this month, the current water year accumulation trace is bending toward the traces of analog water years 2018–19 and 2024–25. See the Insights Section for accompanying graphic and a comprehensive discussion of January and beyond.
- Please note, observed reservoir inflows through January 31, 2026, are available in the CRAFT section of the portal.
