June 5, 2025
Core Supply Dashboard
April in Review
In the month of April, the Core Supply region gained 1.66 inches of precipitation, representing an increase of ~5 percentage points. Dive into the Insights section (left sidebar menu) for a more in-depth look at April and how things are looking through May.
The dashboard below shows the Core Supply status (Regions 2, 4, and 6) with National Weather Service data through April 30.
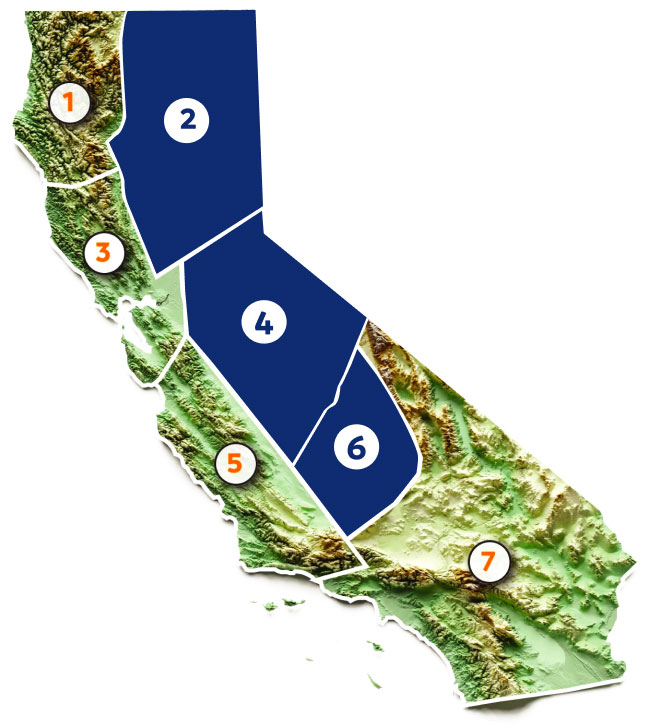
Core Supply:
CAP Forecast WY 2024-25

Core Supply:
Year-over-Year Comparison


Highlights
- The Core Supply region added 1.66 inches in April, bringing the Water Year total to 88.95% of normal, just shy of the forecasted range. While that's well below March’s contribution, how does it compare historically? Over our 8-year data record, this April ranks fifth for precipitation accumulation—right near the middle. Fitting, for a year that’s been all about “average.”
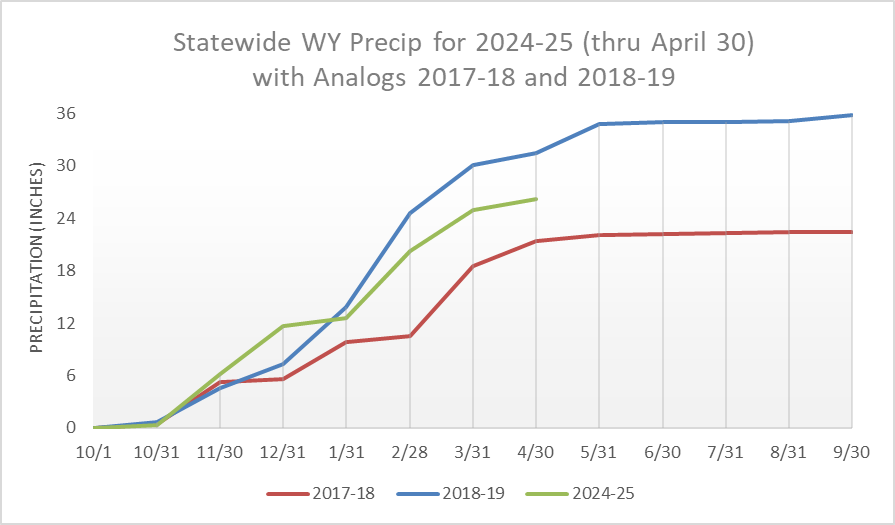
- With April’s accumulated precipitation, this year remains between the traces for analog years of 2017-18 and 2018-19. The plot below shows the Statewide precipitation for the current water year (26.25” through the end of April).