March 28, 2025
Core Supply Dashboard
Data through February 28
The shortest month of the water year packed the biggest punch, with the Core Supply region gaining 9.04 inches of precipitation—nearly 10 times the precipitation in January. This represented 25 percentage points of total WY accumulation! Dive into the Insights section (left sidebar menu) for a more in-depth look at February and beyond, including an update on how the CRAFT forecast compares to the latest B-120 projections.
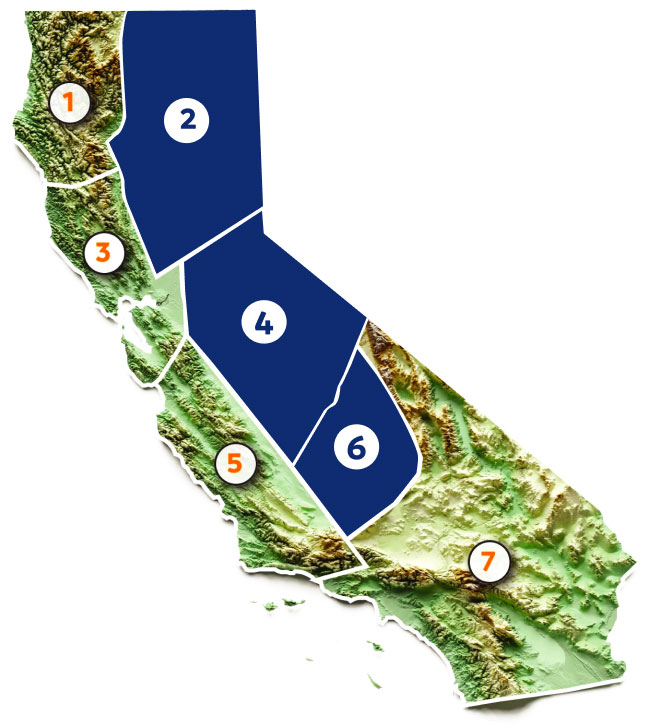
The dashboard below shows the Core Supply status (Regions 2, 4, and 6) with National Weather Service data through February 28.
Core Supply:
CAP Forecast WY 2024-25

Core Supply:
Year-over-Year Comparison


Highlights
- The Core Supply region had its highest monthly gain to date- adding 9.04” in February, bringing the WY to 66.73% of normal.
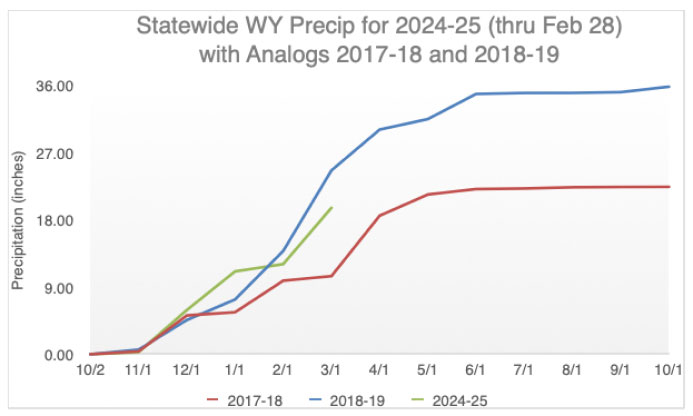
- With February’s boost, accumulated precipitation remains close to the analog years of 2017-18 and 2018-19. The plot below shows the Statewide precipitation for the current water year (19.61” through the end of February), sitting squarely between the totals for 2017-18 and 2018-19.