December 1, 2025
Core Supply Dashboard
WY 2025-26 Precipitation Forecast: Above Normal, Decreasing to the South
Following an “average” year in 2024-25, it looks like much of California will have a chance of experiencing above average precipitation in water year 2025-26, with a modest drying gradient to the south. Refer to the Insights Section for more details (left sidebar).
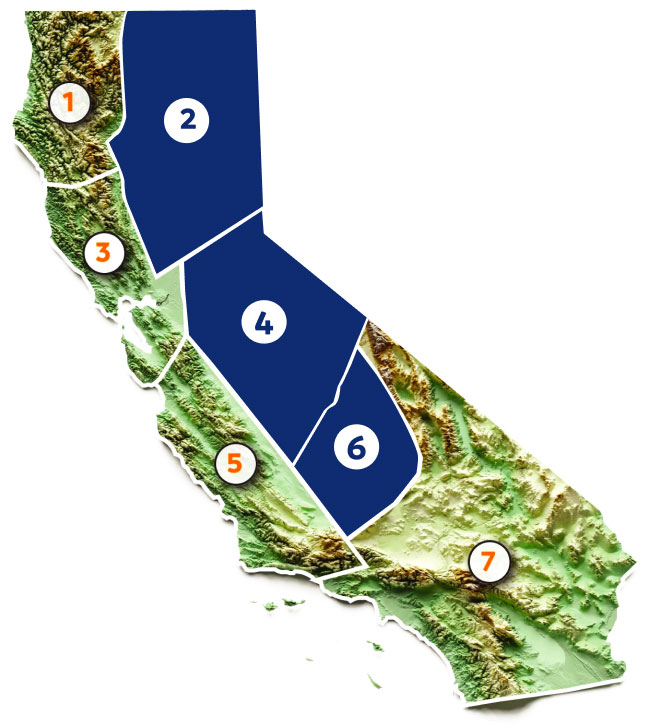
The dashboard below shows the Core Supply status (Regions 2,4, and 6, shaded blue) with observed data through November 29, 2025.
For details by region, see the Regional section below.
Core Supply:
CAP Forecast WY 2024-25

Core Supply:
Year-over-Year Comparison


Highlights
- After a wetter-than-average October, November’s accumulation totals were even more impressive. An atmospheric river event from November 13-17 resulted in significant gains: The Core Supply region gained roughly 4 inches of precipitation from the single event and saw a jump of 10 percentage points.
- The Core Supply typically receives about 4 inches in November, but this month saw 6.33 inches—well above average—and bringing the water year total to 21.60% of normal.
- This wet start to the water year is well-aligned with analog water years 2018-19 and 2024-25. See the Insights Section for more discussion about the where/when/how of this year’s precipitation.
