June 4, 2026
Core Supply Dashboard
WY 2025–26 Precipitation Forecast: Near Normal Overall, Slightly Wetter in the North
Following an “average” year in 2024–25, precipitation for water year 2025–26 is projected to be near normal across California. Forecast guidance suggests a modest north–south gradient, with conditions trending near to slightly above average in the northern portion of the Core Supply region and near to slightly-below average in the south.
See the Regional Sections for a more detailed breakdown by region.
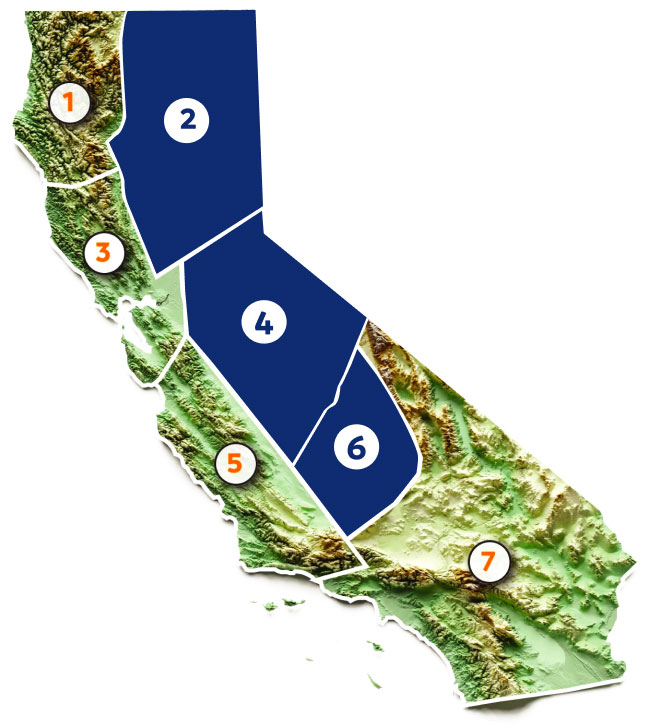
The dashboard below shows the Core Supply status (Regions 2, 4, and 6, shaded orange) with observed data through May 31, 2026.
Core Supply:
CAP Forecast WY 2024-25

Core Supply:
Year-over-Year Comparison


Highlights
- After an outstanding April, precipitation slowed in May. According to NWS totals, the Core Supply received one inch of accumulation, increasing water year progress by approximately 3 percentage points.
- With the Core Supply currently at 94.2% of average based on NWS data and 98.0% using GG Weather, precipitation totals likely fall somewhere between the two estimates, and within the Core Supply forecast range (95-115%).
- NWS precipitation totals reflect broader water supply conditions, while GG Weather values highlight conditions in valley and coastal areas. Visit the Regional Pages to explore conditions most relevant to your operations.
- With May’s modest accumulation, the current water year is tracking closely with analog years 2018-19 and 2024-25. See the Insights Section for accompanying graphics and a comprehensive discussion of precipitation through the end of May.
- Please note, observed reservoir inflows through June 1, 2026, are available in the CRAFT section of the portal.
