November 3, 2025
Core Supply Dashboard
Water Year in Review:
Each water year tells its own story, and this year was no exception. Read on to see the final outcome.
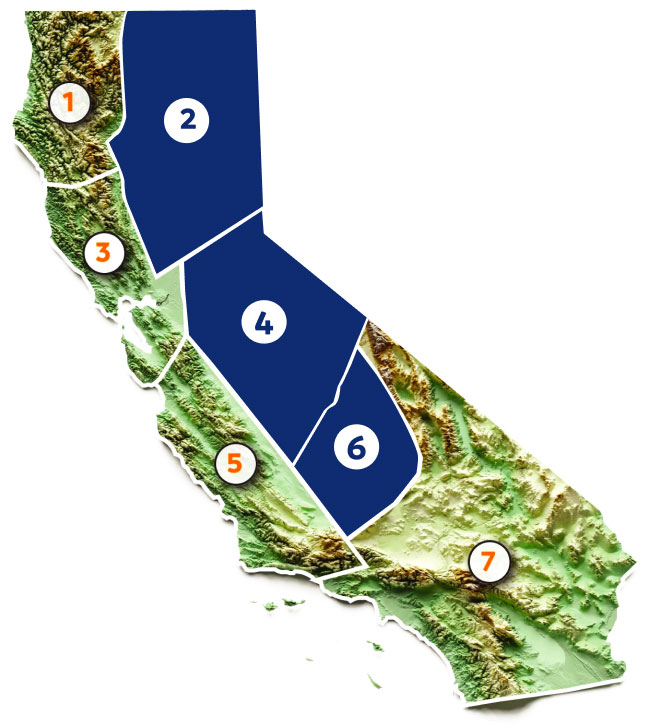
Because of data availability issues with the NWS feed we typically use, we have made some adjustments to our verification framework for this report. For statewide precipitation totals, we have utilized California Water Watch estimates. Year-end totals for the Core Supply are estimated using station data from the regional precipitation indices produced by the California-Nevada River Forecast Center (CNRFC): the 8 stations comprising the Northern Sierra represent our CAP Region 2, the 5 stations of the San Joaquin Basin represent our CAP Region 4, and the 6 stations of the Tulare Basin represent our CAP Region 6.
Since publication of our previous report at the end of the wet season, we have gained roughly 6 percentage points in the Core Supply region to end the water year at ~95% of normal. Dive into the Insights section (left sidebar menu) for a more in-depth look at the water year.
The dashboard below shows the Core Supply status (Regions 2, 4, and 6) through September 30.
Core Supply:
CAP Forecast WY 2024-25

Core Supply:
Year-over-Year Comparison


Highlights
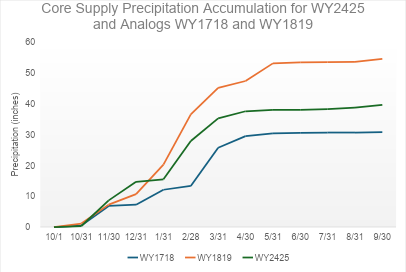
- The Core Supply region gained about 2 inches since the end of April, bringing the Water Year total to 94.78% of normal and within CAP’s forecasted range for the ninth consecutive year.
- At the close of the water year, precipitation accumulation remains between the traces for analog years of 2017-18 and 2018-19. The plot below shows the Core Supply precipitation for the current water year alongside the analogs.