March 11, 2026
Core Supply Dashboard
WY 2025–26 Precipitation Forecast: Near Normal Overall, Slightly Wetter in the North
Following an “average” year in 2024–25, precipitation for water year 2025–26 is projected to be near normal across California. Forecast guidance suggests a modest north–south gradient, with conditions trending slightly above average in the northern portion of the Core Supply region and near to slightly-below average in the south.
See the Regional Sections for a more detailed breakdown by region.
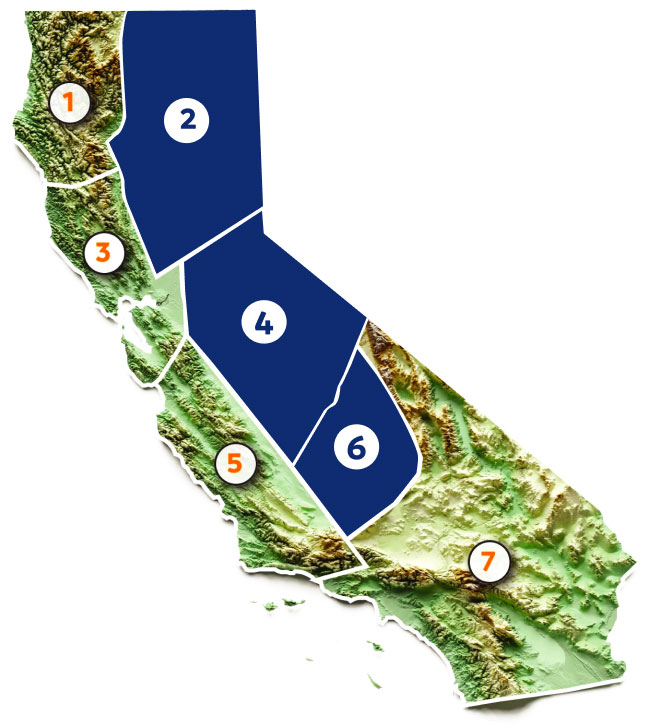
The dashboard below shows the Core Supply status (Regions 2, 4, and 6, shaded orange) with observed data through March 9, 2026.
Core Supply:
CAP Forecast WY 2024-25

Core Supply:
Year-over-Year Comparison


Highlights
- Beginning this month, precipitation observations have been updated to incorporate additional valley-floor stations, improving spatial representation across the watershed and resulting in slight differences from previously reported values for the Core Supply and individual regions.
- Late February storms resulted in a monthly accumulation of 5.77 inches through March 9 for the Core Supply region, increasing water year progress by just over 21 percentage points.
- With a total water year accumulation of 24.16 inches, the Core Supply sits at 89.13% of water-year average, roughly 6 percentage points shy of the CAP forecast range.
- The current water year accumulation trace continues to track closely with analog water years 2018–19 and 2024–25. See the Insights Section for accompanying graphics and a comprehensive discussion of precipitation through February and into March.
- Please note, observed reservoir inflows through February 28, 2026, are available in the CRAFT section of the portal.
