May 7, 2025
Core Supply Dashboard
March in Review
In the month of March, the Core Supply region gained 6.19 inches of precipitation, representing an increase of ~17 percentage points. Dive into the Insights section (left sidebar menu) for a more in-depth look at March and how things are looking through April.
The dashboard below shows the Core Supply status (Regions 2, 4, and 6) with National Weather Service data through March 31.
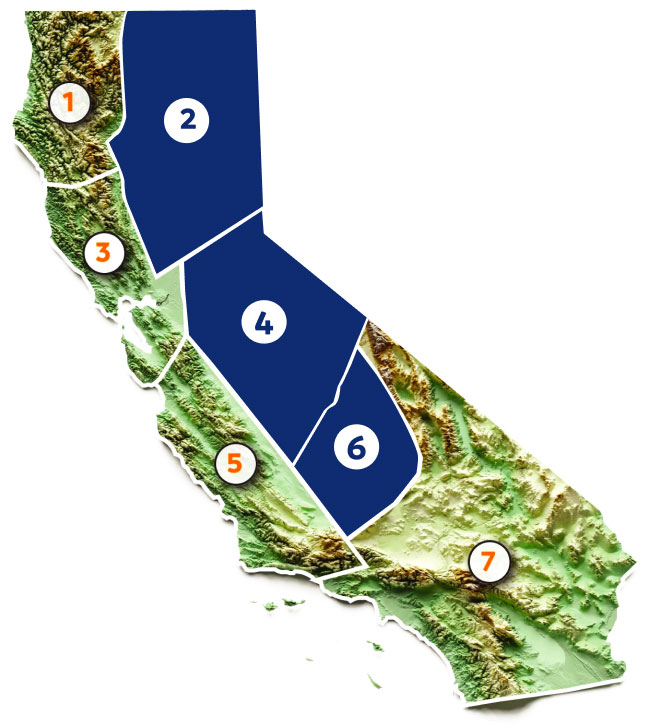
Core Supply:
CAP Forecast WY 2024-25

Core Supply:
Year-over-Year Comparison


Highlights
- The Core Supply region added 6.19 inches in March, bringing the Water Year total to 83.62% of normal. While not as large as February’s bump, March’s contribution marked continued progress toward normal water year accumulation.
- This year’s accumulation remains between the traces for analog years of 2017-18 and 2018-19. The plot below shows the Statewide precipitation for the current water year (24.07” through the end of March).

