March 3, 2025
Statewide Dashboard
January in Review
In the fourth month of the water year, the state region gained a mere 0.95 inches of precipitation, adding 4.11 percentage points to the total WY accumulation. Dive into the Insights section (left sidebar menu) to better understand just how dry January was and what lies ahead- including updates on our R&D efforts.
The dashboard below shows the Statewide status with National Weather Service data through January 31.

Statewide:
CAP Forecast WY 2024-25

Statewide:
Year-over-Year Comparison


Highlights
- The state added 0.95” to its WY accumulation in the month of January, bringing the WY to 39.96% of normal.
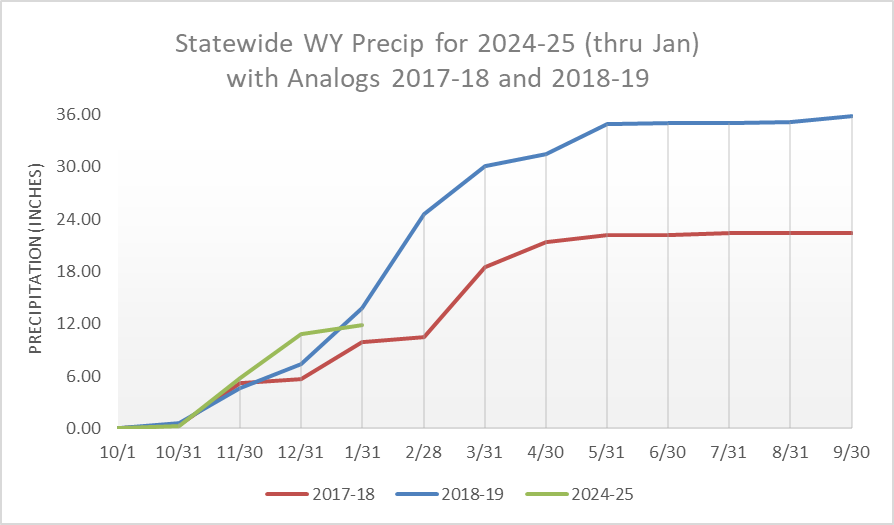
- Accumulated precipitation remains close to the analog years of 2017-18 and 2018-19. The plot below shows the Statewide precipitation for the current water year (11.82” through the end of January), now sitting between the totals for 2017-18 and 2018-19 (with 9.85” and 13.83”, respectively, through January).