Initial 2025-26 Water Year Forecast
Where are we headed?
I’ve been a runner my whole life (Jackie, not Rob), racing every distance from sprints up to a full marathon. No two races have ever been the same; some were measured and methodical around a track while others wound through rough, unpredictable terrain with plenty of hills.
But one thing has been true every time I’ve toed the starting line: I knew where the finish line was. I knew where I was headed.
As we collectively toe the starting line of a new water year, there’s no shortage of voices describing what the course might look like or where the finish line could be.
Twists and Turns
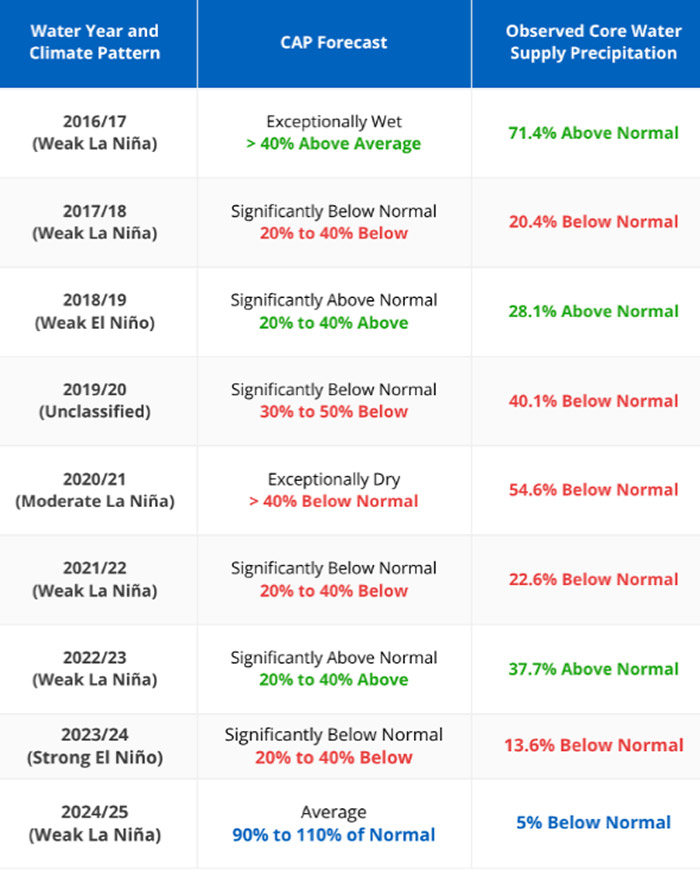
NOAA’s Climate Prediction Center reports that La Niña conditions are present and favored to persist through early winter, with a transition to ENSO-neutral likely by January – March 2026. In the CAP data record, other weak La Niña years have been associated with varied precipitation patterns for the Core Supply region (see point #2 on homepage). Across the full spectrum of La Niña outcomes, CAP has consistently verified.
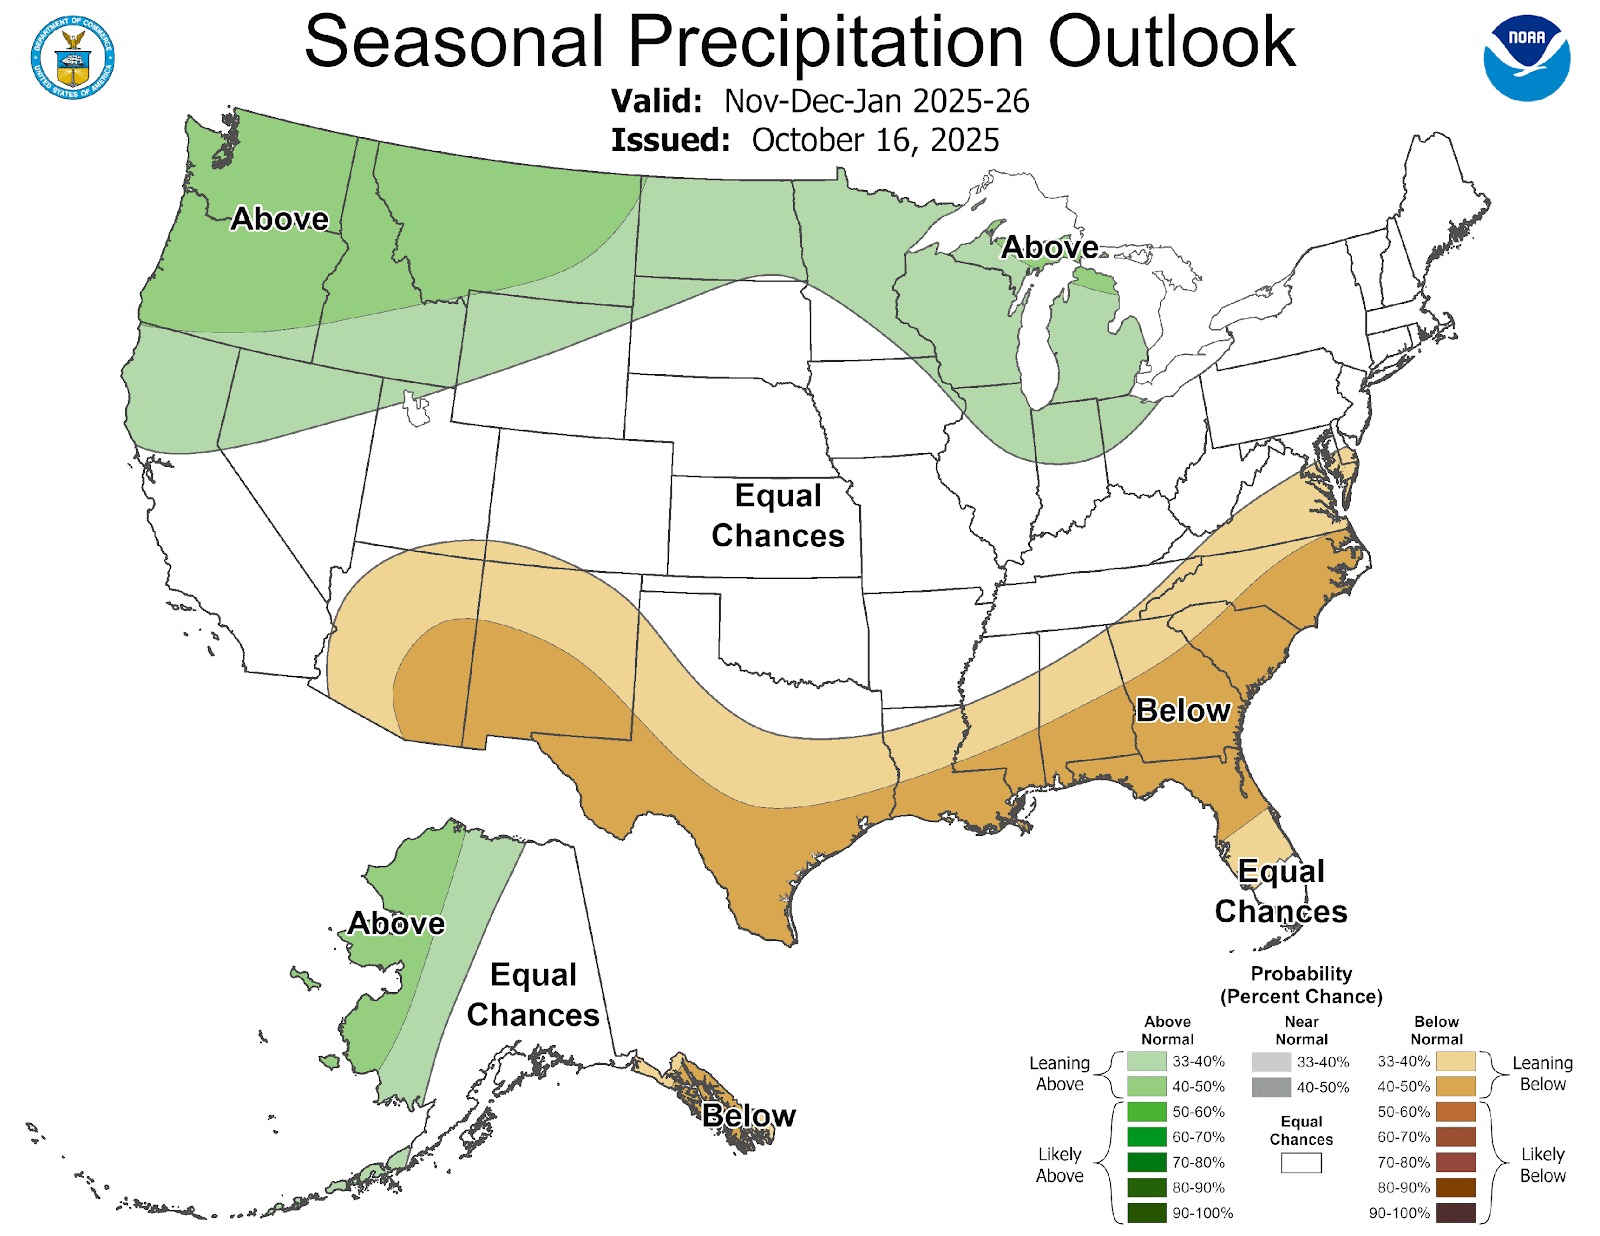
Meanwhile, NOAA’s seasonal precipitation outlook (below) indicates “equal chances” of above- or below-normal precipitation for roughly two-thirds of the state and a 33–40% likelihood of above-normal totals in the northern third of the state from November through January. For water managers, this broad assessment offers little practical guidance.
While there isn’t a clear consensus on whether the year will be wet or dry, there is growing agreement on the likelihood of large swings in precipitation. As one study notes, “Precipitation extremes—wet to dry or dry to wet—are projected to increase by 25% to 100% in California despite only modest changes in mean precipitation.”1Their central finding was that even if total annual precipitation changes only modestly, the amplitude and frequency of swings between wet and dry periods, whether year-to-year or within-season, are projected to intensify, leading to greater volatility in the state’s precipitation patterns.
California’s Department of Water Resources shares that caution. “The past decade has clearly demonstrated the need to prepare for extremes,” said State Climatologist Dr. Michael Anderson.2
In other words, we have an idea of what the course might hold—steep climbs, sharp descents—but the finish line remains uncertain.
CAP Brings Clarity
CAP brings clarity and vision for the finish line, transforming uncertainty into direction and helping California’s water community run its race with confidence.
Just as every runner’s race is a little different, so too is every region’s path through the water year. With our ever-expanding weather station network, CAP is now giving us our first reliable glimpse into precipitation gradients across the state, providing region-specific insight rather than a single statewide number.
A New Level of Detail
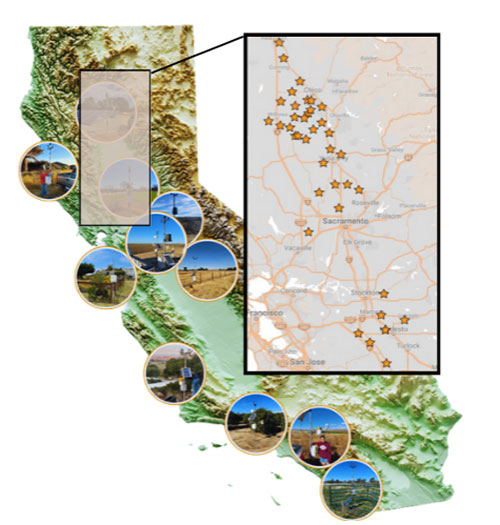
If you were a subscriber last year, you may recall that Rob noted a gradient feature in the model output for WY 2024-25. At the time, that signal was an observation, not yet part of our operational product. Verification analysis confirmed that the north–south gradient in observed precipitation aligned with the forecast. With that confirmation, an expanded station network (right), and historical validation we advanced this capability into full operational use for WY 2025–26.
This year marks a major step forward for CAP. For the first time, the forecast distinguishes regional differences in precipitation totals. In previous years, CAP provided a single statewide range – a valuable benchmark, but it didn’t provide customers with the level of geographic detail needed to truly empower planning and decision-making.
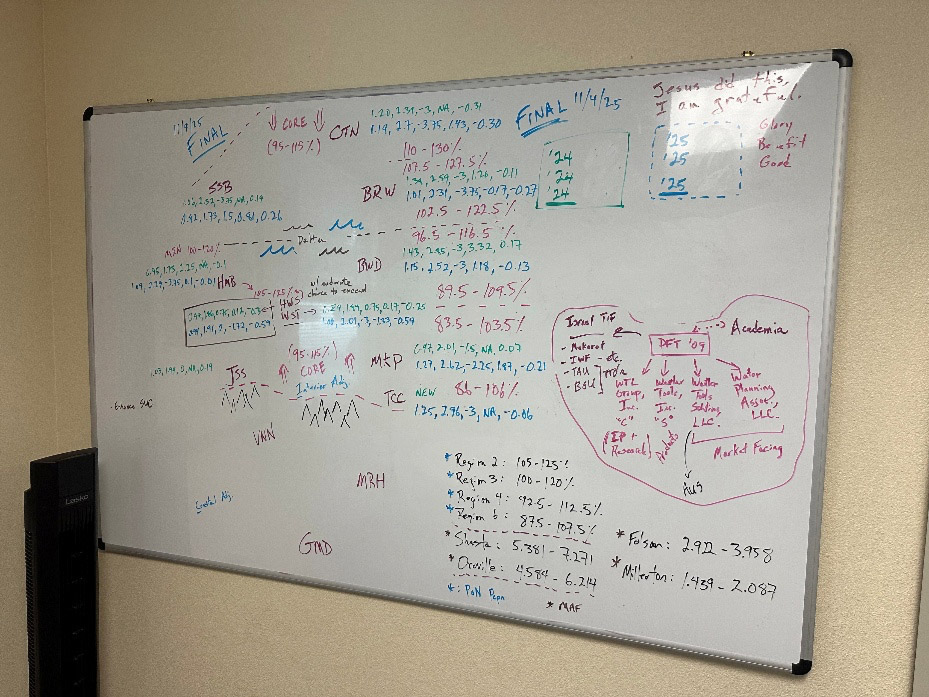
What used to be one range has expanded into an array of forecasts. Rob’s whiteboard offers a glimpse into the process: the layers of notes and calculations illustrate the complexity of transforming atmospheric data into actionable guidance.
For WY 2025-26, CAP indicates a pattern of above-normal precipitation throughout the Core Supply region: roughly 105-125% of normal across the northern half of the Sacramento Valley, tapering to about 87.5-107.5% of normal across the southern San Joaquin Valley.
This year, virtually every Atmospheric Change Index (ACI) from the CAP model points to a somewhat wetter water year relative to last across all areas within the Core Water Supply domain. Furthermore, pre-season ACI characteristics suggest an elevated likelihood of possibly exceeding forecast precipitation ranges.
Each improvement makes the forecast more usable and more directly tied to operational realities. We will continue investing in instrumentation and research to deliver greater operational value to our customers.
Every water year is different, and our goal is to help you run your 2025–26 water-year race with clarity and confidence.
1 Swain, D. L., Langenbrunner, B., Neelin, J. D., & Hall, A. (2018). Increasing precipitation volatility in twenty-first-century California. Nature Climate Change, 8(5), 427–433. https://doi.org/10.1038/s41558-018-0140-y
2 California Department of Water Resources (2025, September 30). California Prepares for Extreme Weather Swings as New Water Year Begins. https://water.ca.gov/News/News-Releases/2025/Sep-25/California-Prepares-for-Extreme-Weather-Swings-as-New-Water-Year-Begins
