Water Year 2024–25: A Normal-Looking Elephant from Afar
Back in the fall, we opened our CAP forecast with a familiar parable: a group of blind men encounters an elephant, each describing it differently based on the part they touch. One feels what he believes is a snake, another a tree, another a rope. We used that story to illustrate how focusing on any one part of California’s water year—climate drivers or atmospheric rivers—can distort the bigger picture. CAP’s view of the whole elephant pointed to something simple and surprisingly bold: a near-normal water year.
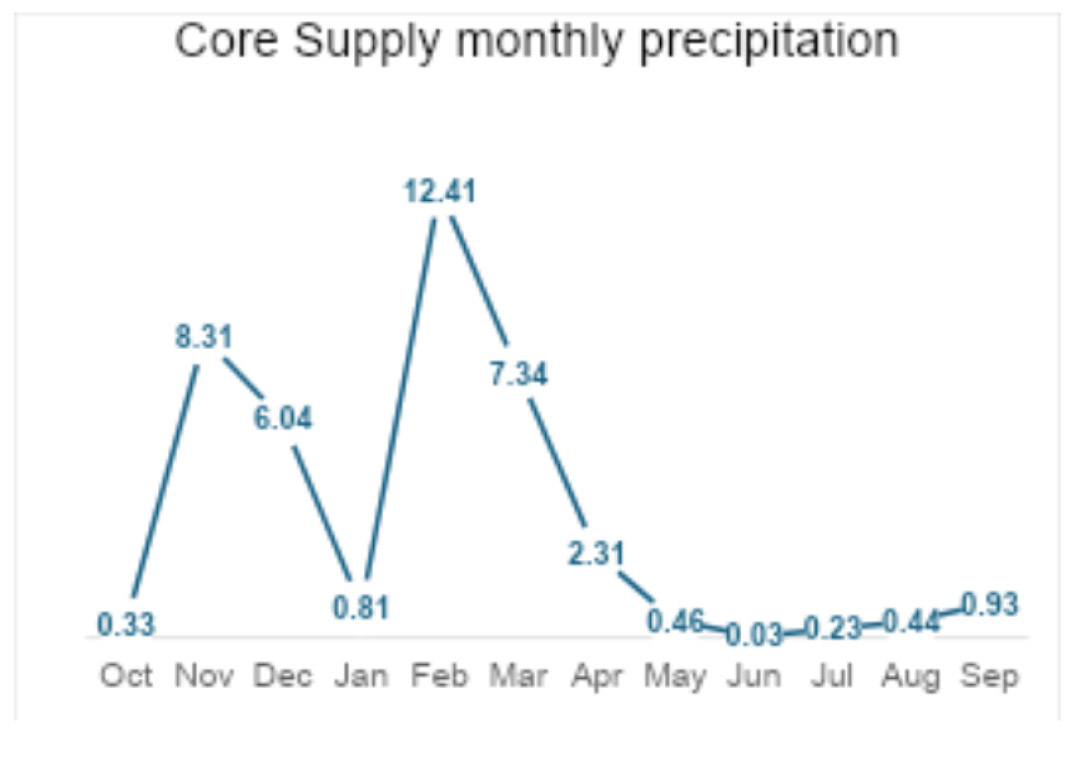
Now, at the close of WY 2024-25, that prediction proved true, but not in a straightforward way. The “average” outcome emerged from a year of opposites: months that oscillated between wet and dry (see right), and regions that diverged from one another. Northern California finished slightly above average, while the southern half of the state lagged behind.
Statewide precipitation settled around 96 percent of average, with Core Supply basins near 95 percent, both within CAP’s projected range of 90–110%. In other words, the elephant was indeed normal-looking, once you took a step back.
Precipitation Gradient
In October 2024, as we reviewed the CAP model output, Rob sketched California on his whiteboard and drew a line from Half Moon Bay to Modesto, noting how the model indices shifted. Even without a formal gradient feature in our operational forecast, the signal was there: a decrease in precipitation south of that dividing line.
At the time, it was only a hypothesis, an insight visible to us in the model analysis but not something we were ready to incorporate into the published forecast.
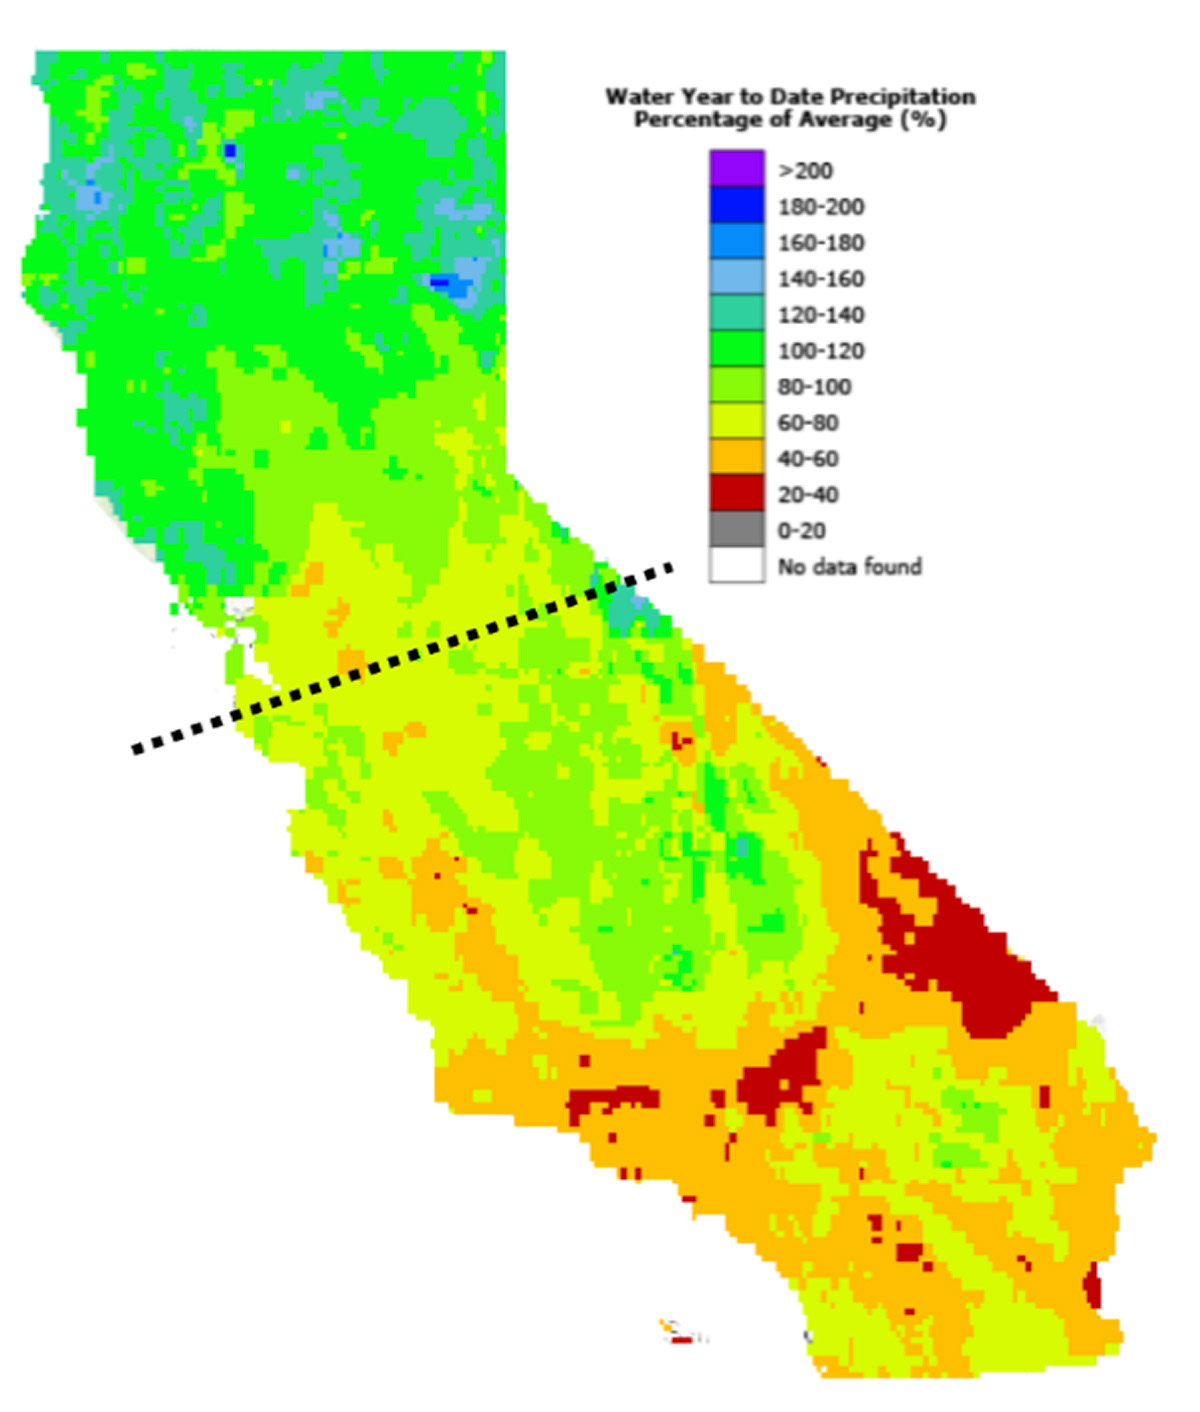
Months later, the gauges confirmed what that whiteboard showed. The observed data had a clear north–south gradient: wetter-than-average totals in northern California and drier conditions through the San Joaquin Valley and further south. The CWW map through September 30 (left) illustrates the pattern: northern sections comfortably above normal, southern sections falling below.
The verification of this gradient will help translate these signals into more explicit regional guidance going forward.
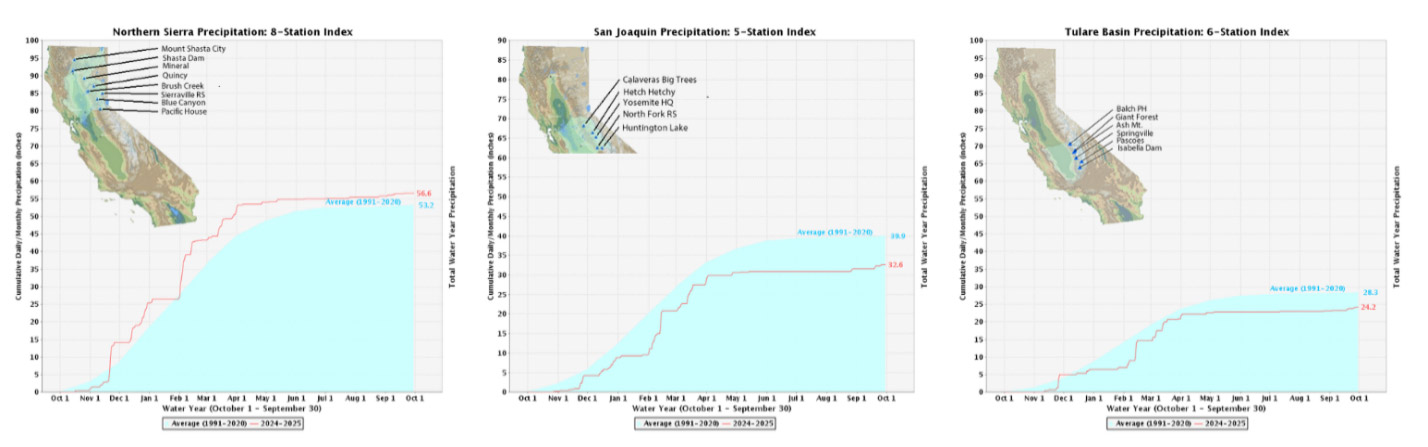
The Northern Sierra, San Joaquin, and Tulare Basin precipitation indices for Water Year (WY) 2024–25 are shown below. These precipitation traces tell the same story from another view. The Northern Sierra (left) finished the water year about 6% above normal. Further to the south, the San Joaquin (middle) and Tulare Basin (right) were both about 18 percentage points below normal. The gradient is visible as we go from north to south (left to right), but their weighted average, representing the Core Supply region, was ~95% of normal preciptiation.
What story will Water Year 2025-26 tell? We’ll find out soon; next year’s forecast is just days away!
