Monthly Update: Insights through March 9
Spatial Pattern Update
Overall precipitation totals across the Core Supply region remain on track to verify within the forecast range. However, the north–south gradient observed so far this water year differs from the pattern anticipated in the November outlook. The initial forecast called for slightly wetter conditions in the northern portion of the state and near- to slightly below-average precipitation in the south. To date, observed totals show a more uniform distribution, with southern regions currently tracking somewhat higher relative to normal than northern areas. We continue to train the machine learning model to better understand the cause of this gradient and to enhance forecast performance going forward.
Visualizing the Precipitation
California Water Watch (CWW) precipitation maps, with CAP regions overlaid, illustrate water-year-to-date precipitation patterns through February 1 (left) and March 9 (right).
The February 1 map shows widespread above-average precipitation across much of the state. Much of CAP regions 4–7 exceeded 140% of normal (to date) through February 1.
Following the late-February storms, the overall spatial pattern remains similar. Regions 1–4 appear largely unchanged, while regions 5–7 show a slight shift toward relatively drier conditions compared to the February 1 snapshot, as areas that previously exceeded 200% of average have moderated into the 140–200% range.

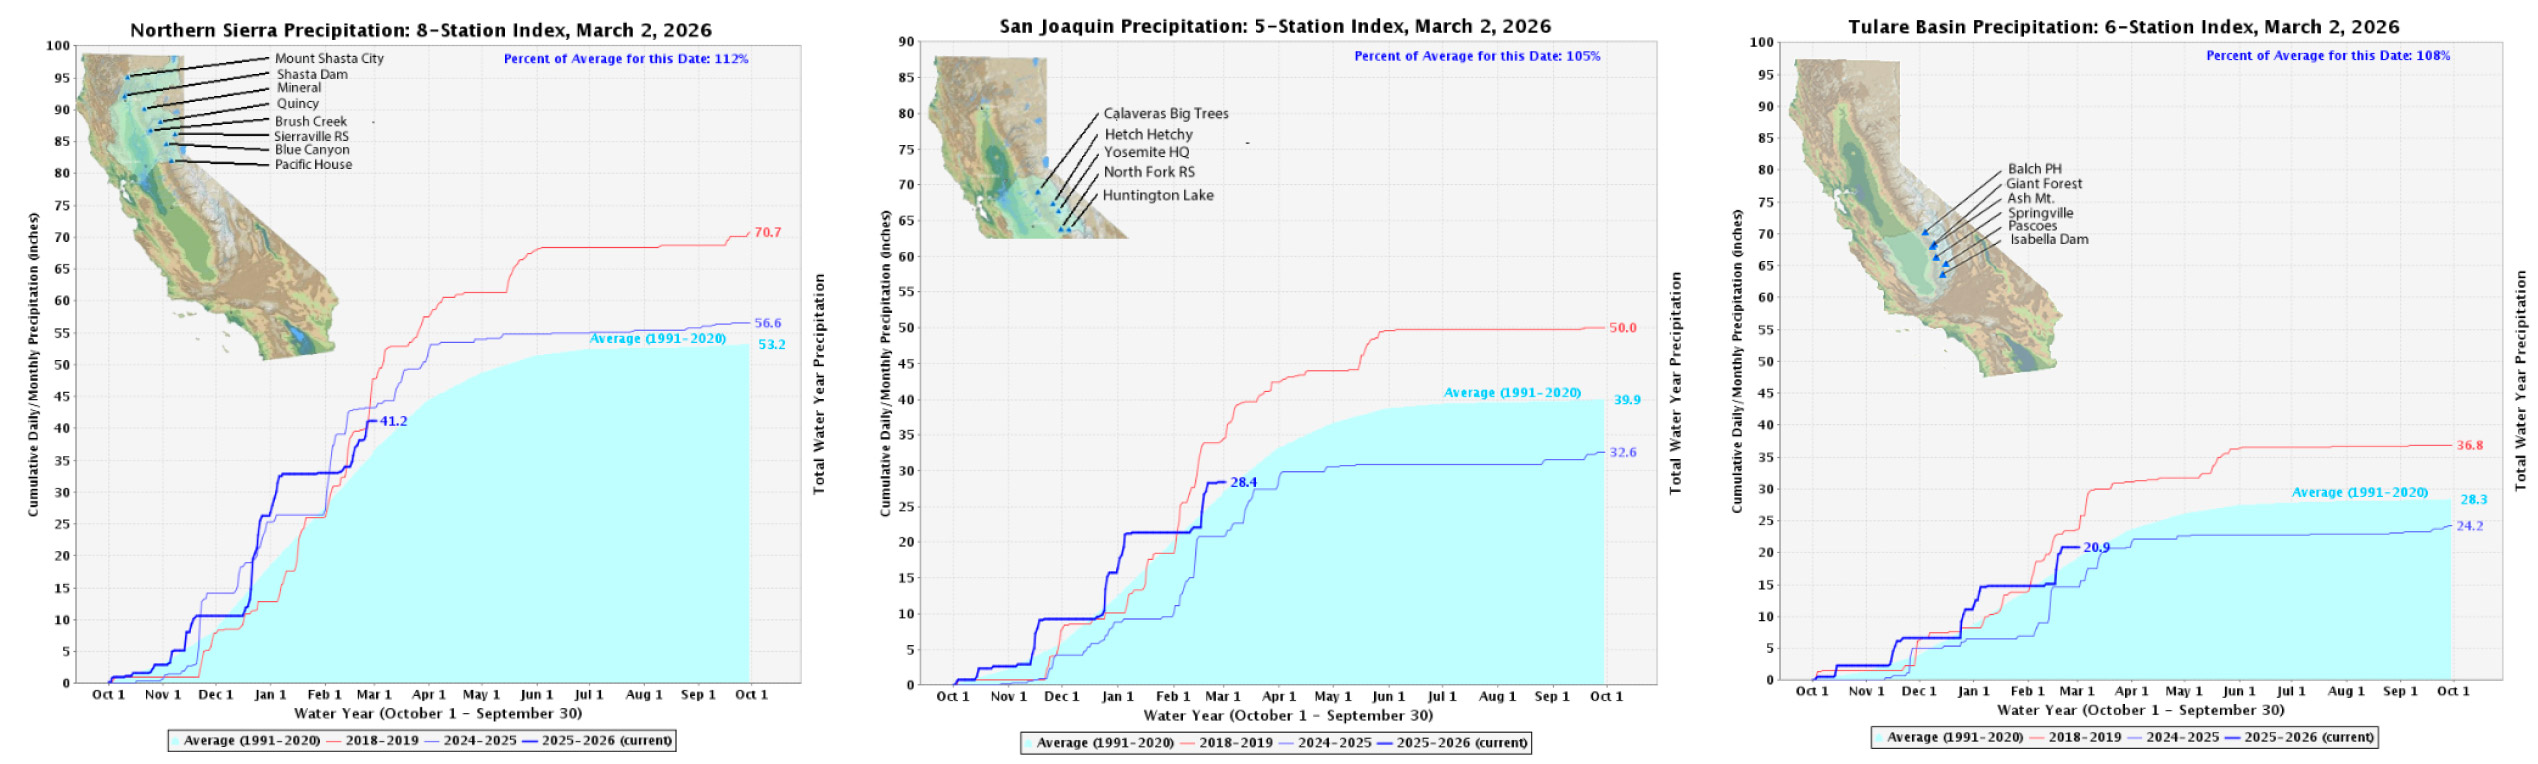
How are the Analogs Looking?
At the start of the water year, we noted similarities in key model indices between the current year and water years 2018–19 and 2024–25, and we have continued to monitor these analogs throughout the season. The adjacent charts show precipitation accumulation traces for the 8-, 5-, and 6-station indices, with the current year highlighted in bold blue and the analogs in light blue and red.
Interestingly, as of February 1, accumulation totals for the current year were higher than both analogs across all regions. However, a quiet, flat start to the month brought totals back between the analog years.
Following the late-February storms, Northern Sierra accumulations are currently tracking slightly below the analog envelope, while totals in the San Joaquin and Tulare basins remain squarely between the two analogs.
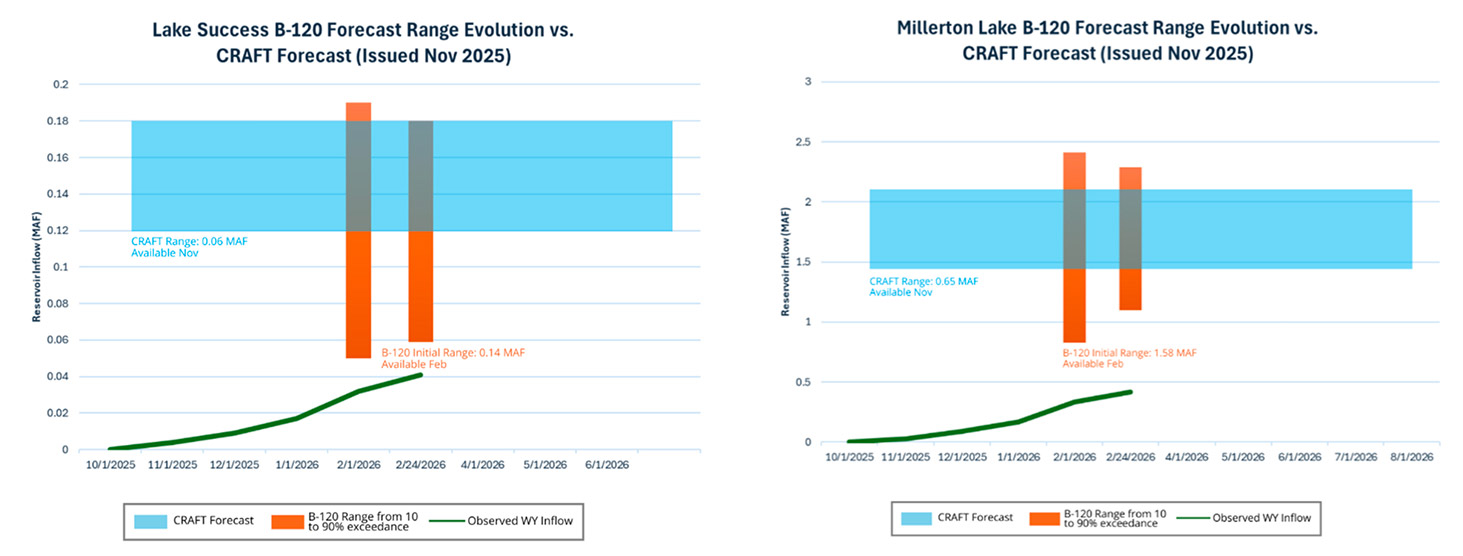
Reservoir Status
This section highlights four reservoirs; additional information on inflow forecasts and observed inflow to date can be found within the CRAFT section of the portal.
Starting in February, the Department of Water Resources provides the Bulletin 120 (B-120) forecasts, reflecting evolving hydrologic conditions based on observed precipitation and historic inflows. The B-120 offers a dynamic, regularly updated perspective as the season progresses, while CRAFT delivers a single, fixed-range inflow forecast issued each November—well ahead of the B-120’s initial February release.
The plots below show a side-by-side view of CRAFT inflow forecasts for four featured reservoirs alongside the state’s initial B-120 forecasts and the observed inflow.
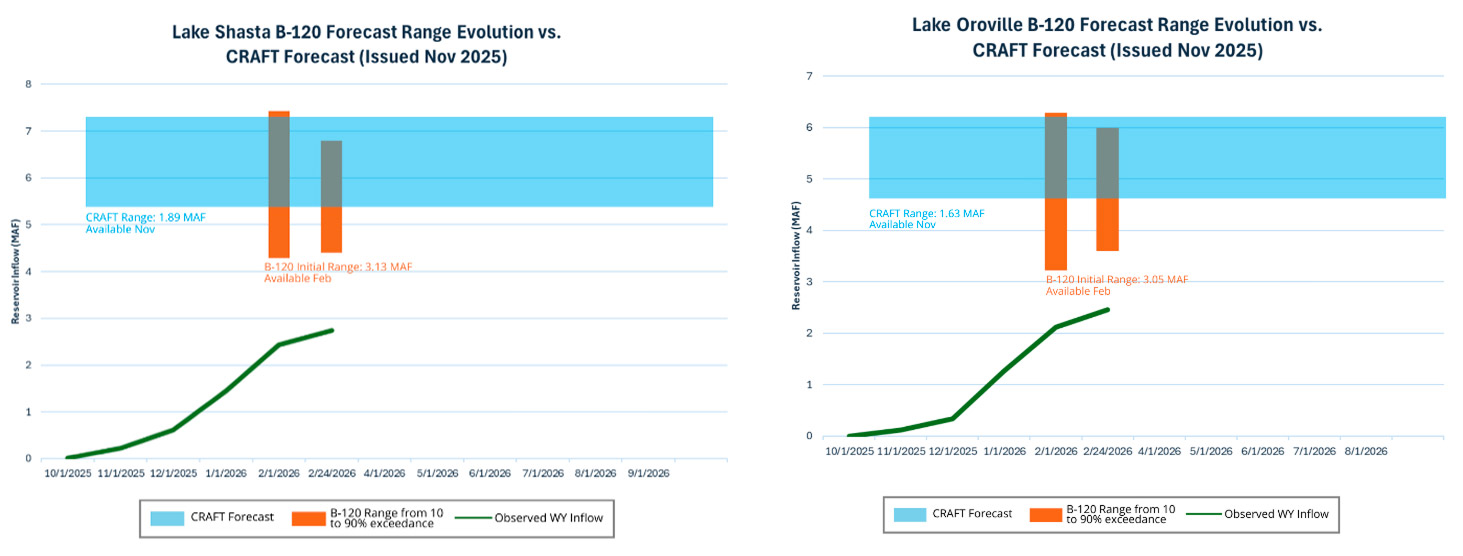
By visualizing both forecast approaches on the same timeline, it is evident that CRAFT complements existing state guidance—filling a critical early-season need for inflow estimates while aligning with later updates from B-120. Together, these tools provide a more complete picture of water year expectations for California’s reservoirs.
We will continue tracking the progress of the observed inflow toward our fixed CRAFT forecast.