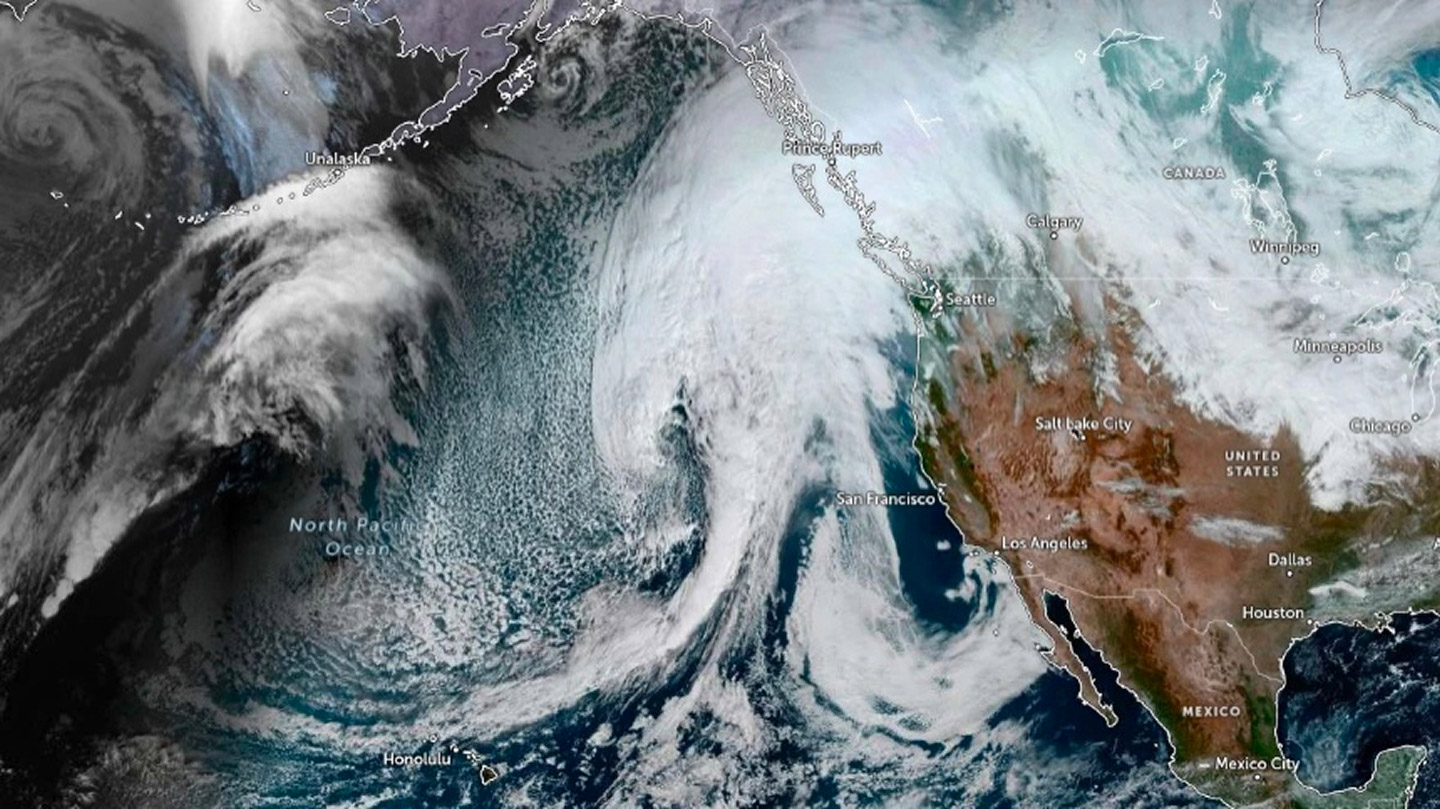
Real-Time Insights on the November 13–17 Precipitation Event
The November 13–17 atmospheric river event delivered meaningful precipitation across California. While some valley locations saw eye-catching gains, our primary focus is how this storm advanced the Core Water Supply region toward the CAP forecast.
Core Water Supply: 8-, 6-, and 5-Station Indices
Because the Core Water Supply region is driven by foothill and mountain precipitation, we evaluate the Sierra indices as the clearest measure of event impact.
- Region 2 (SYFA): Northern Sierra 8-Station Index
The index accumulated 4.26 inches, gaining 8.01 percentage points and reaching 17.66% of average for the water year through November 17. - Region 4 (SJ-T): San Joaquin 5-Station Index
The 5-station index recorded 5.04 inches, a 12.62-point jump, pushing totals to nearly 20% of average for the water year. - Region 6 (KTKK): Tulare 6-Station Index
The 6-station index added 2.93 inches, increasing more than 10 points and reaching 18.65% of average through November 17.
You may recall from our forecast release that Water Year 2018–19 (Weak El Niño) and Water Year 2024–25 (Weak La Niña) share key model indices that most closely align with the present year. The precipitation traces for these analogs are shown below, with the current water year marked by the blue dot. Each basin is now well above normal for mid-November and showing a strong early-season start—much like the analog years.

NWS Real-Time Station Data
The NWS real-time feed provides single-station snapshots within each region. The values below highlight stand-out storm accumulations in each region, but should not be interpreted as representative of the region as a whole.
- Region 2 – Sacramento / Yuba / Feather / American
Sacramento Airport gained 13.56 points. - Region 3 – San Francisco Bay
San Jose Airport rose 13.2 points. - Region 4 – San Joaquin & Tulare
Merced stood out with a 26.02-point jump. - Region 5 – Central Coast
Paso Robles recorded a 21.65-point increase. - Region 6 – Kern & Kings
Bakersfield posted a 29.25-point gain. - Region 7 – Southern California
Santa Barbara recorded the largest single-station increase in the entire dataset, jumping 48.81 points.
Several stations saw gains that far outpaced their region’s overall accumulation. For example, Region 4 advanced approximately 13 percentage points, yet Merced jumped 26.02 points on its own. Similarly, Region 6 gained about 10 points, while Bakersfield surged 29.25 points. These outsized single-station increases provide insight into the storm’s structure.
During this event, the strongest circulations propagated offshore and then re-entered the state from the south. That southerly flow isn’t ideal for generating orographic lift in the Sierra, so the foothill and mountain locations (which drive Core Supply) didn’t benefit as they otherwise would. At the same time, the system carried substantial convective energy. Those convective bands produced short-duration, high-intensity rainfall that favored low-elevation locations. As a result, many valley stations posted standout single-day jumps, while the region as a whole advanced more moderately.
Visual Analysis
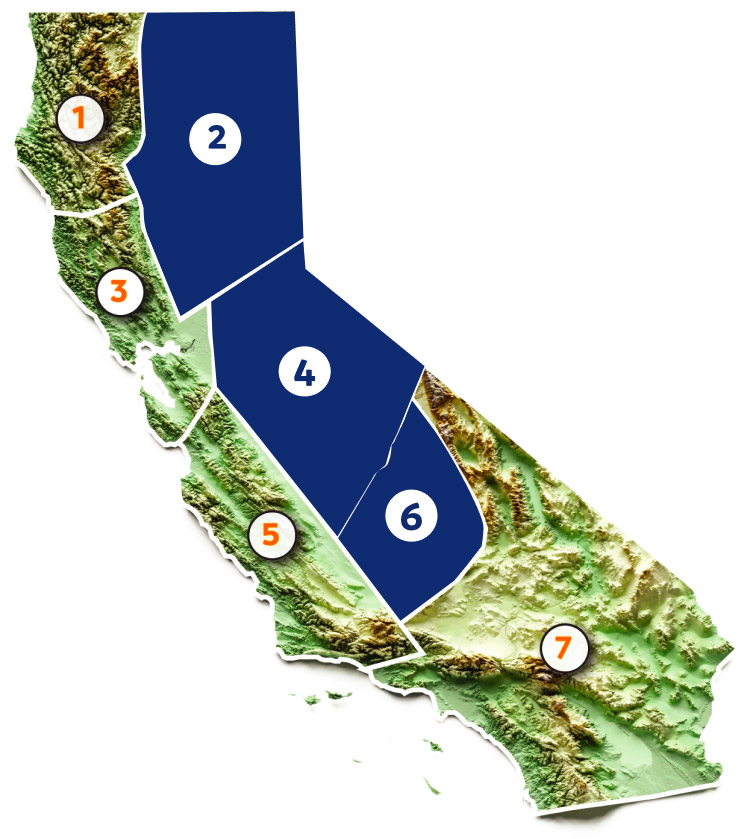
The images below, from California Water Watch, show water-year-to-date precipitation estimates as a percentage of average. The left image captures conditions prior to the precipitation event (through November 12, 2025), while the right image shows conditions following its conclusion (November 17, 2025). Overlaid on these images are the approximate boundaries of the CAP regions, providing a clear view of the spatial distribution of precipitation.
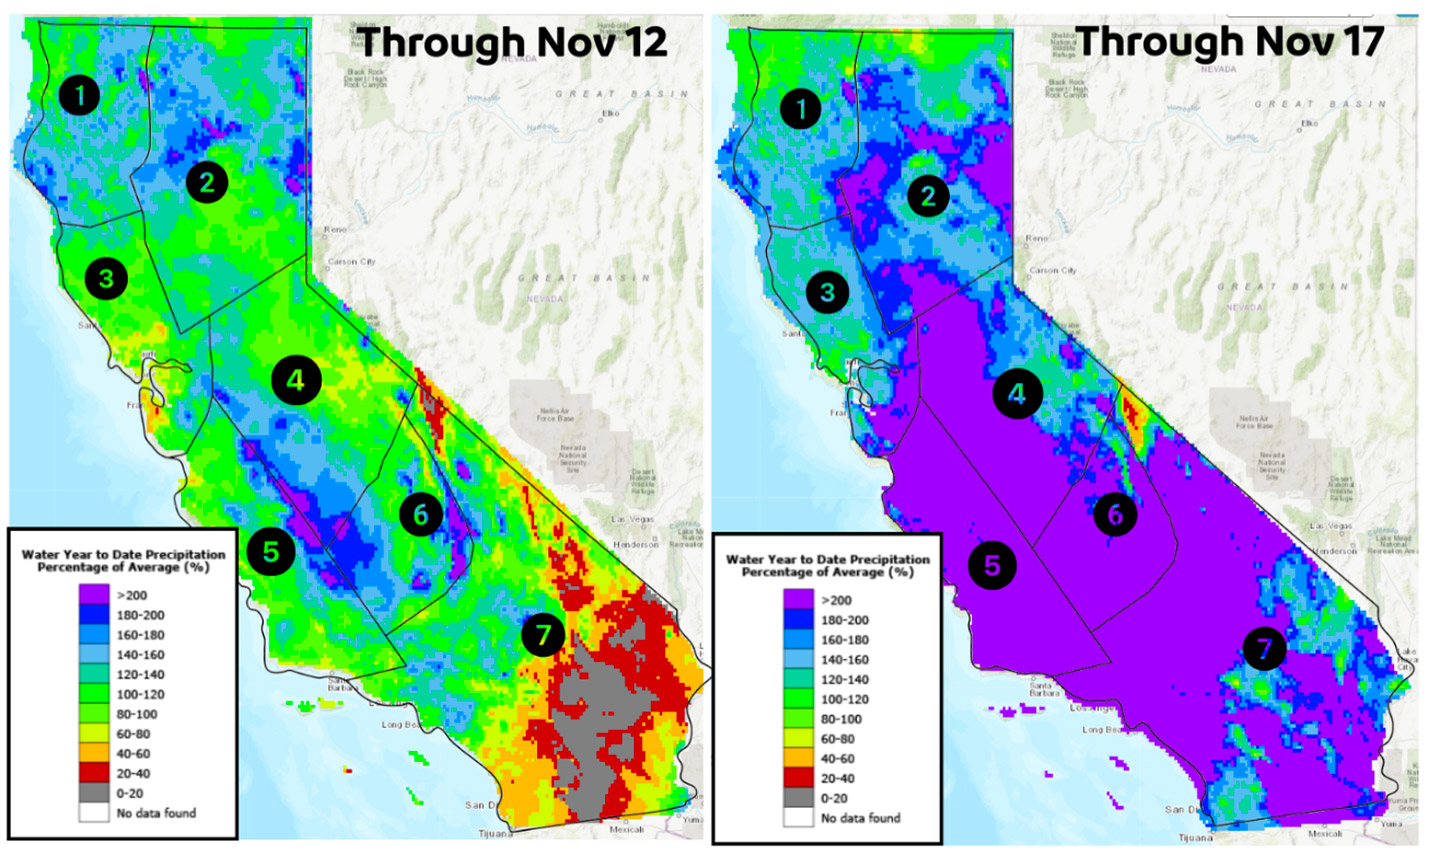
The side-by-side maps illustrate how dramatically conditions changed across California from November 13 to 17. Through November 12, most regions sat near or below average for the water year, with Southern California being especially dry. By November 17, every region from north of the San Francisco Bay through the Sierra and down across the Transverse Ranges saw a major jump in water-year-to-date precipitation.
Northern and Central California surged from near-normal into well-above-normal, often exceeding 160–200% of average. Southern California experienced the most dramatic turnaround, with several areas shifting from 20–60% of normal to over 120% in just five days. This single event transformed the statewide picture, pushing nearly every region into solidly above-average conditions for mid-November.
Summary
The November 13–17 event produced a clear and measurable advance in the water year. The Sierra indices, our best indicators of Core Water Supply progress, now sit well above normal. These gains represent meaningful early-season progress toward the CAP forecast as we head into December.
