Putting Southern California’s Dry Start into Perspective
In the aftermath of tragedy, the natural response is to look back, assess what happened, and determine how to prevent it in the future. The recent Southern California wildfires have sparked a flood of analysis, with much of the public conversation pointing to the “extreme” conditions that fueled the devastation. Was it the powerful winds? The dry ground? While these factors are undoubtedly significant, data can help give an objective perspective. So, just how dry is Southern California? And is this an exceptional year?
A Closer Look at the Data
Concerns about Southern California’s dry start to the wet season have drawn significant attention, with media outlets warning of early drought conditions. While Southern California has been dry, it is not an outlier when looking at previous years.

The image to the right shows water year accumulation for CAP’s Region 7 (Southern California) over the past eight water years alongside the current water year. Although WY 2024-25 (white) falls on the lower end of the spectrum, it does not stand out as an anomaly. While precipitation totals in Southern California through December are modest, they fall between the traces of our identified analog years (WY 2017-18, pink, and WY 2018-19, blue). This suggests that the water year’s progression may not be "lagging" but instead unfolding in a way consistent with past years that began under similar conditions. Low accumulation at this stage of the water year does not always mean a dry outcome. A recent article in the Los Angeles Times1 noted that the South Coast hydrologic region has seen less than an inch of precipitation by January in just ten other water years. However, some of those years ultimately recovered to achieve near- or above-average totals.

Perhaps the bigger story isn’t the lack of precipitation, but rather when it has fallen. The abundant precipitation Southern California received in both WY 2022-23 and 2023-24, showcased in the plot to the right, allowed for extensive vegetative growth, which later became abundant wildfire fuel.
This pattern has been observed in previous fire seasons: above-average precipitation leads to explosive vegetation growth, followed by dry conditions and Santa Ana winds that transform this fuel into a wildfire hazard. While a dry start to WY 2024-25 has drawn concern, the effects of the previous wet years may have played a more significant role in setting the stage for recent fire activity.
Zooming out from Southern California, we turn our attention to the state as a whole, examining the precipitation patterns that shaped December and the trends emerging in January.
December and Beyond
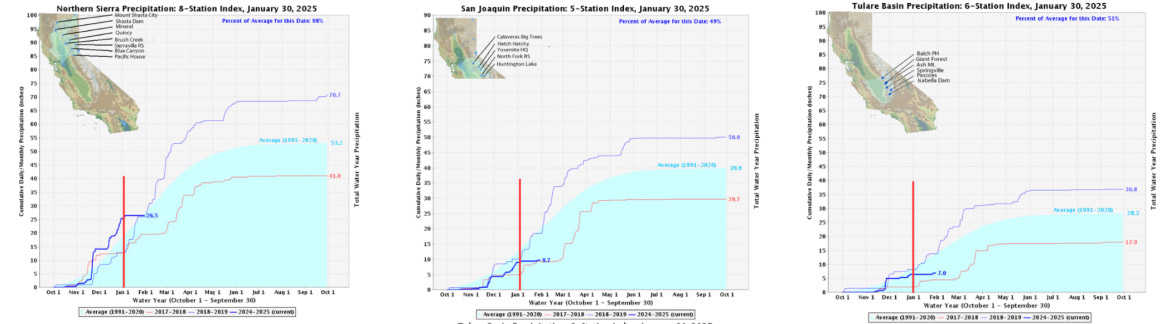
The Northern Sierra, San Joaquin, and Tulare Basin precipitation indices for WY 2024-25 and the two analog water years are shown below. The vertical red line marks the end of December. To the left of this line, you can see the bump in precipitation associated with the mid- and late- December storms. However, to the right of this line, precipitation has nearly flatlined.
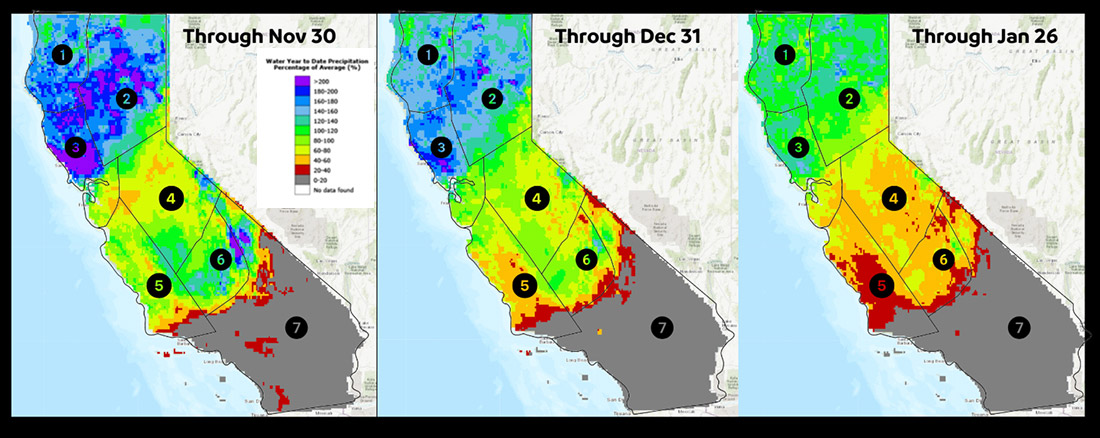
The California Water Watch (CWW) precipitation estimates below display accumulation through the end of November (left), December (middle), and January 26 (right). The color scale (below) indicates the water year-to-date precipitation percentage of average.
The CWW images show that from November to December, some areas, particularly portions of Regions 4 and 5, saw increased percent accumulation as indicated by the transition from oranges and yellows to yellows and light greens, respectively. However, from the end of December to January, shading across most regions shifted to lower precipitation categories, signaling that little to no precipitation was received. As a result, many areas are now drier, in a relative sense, than they were at the end of December.
What can we expect from February?
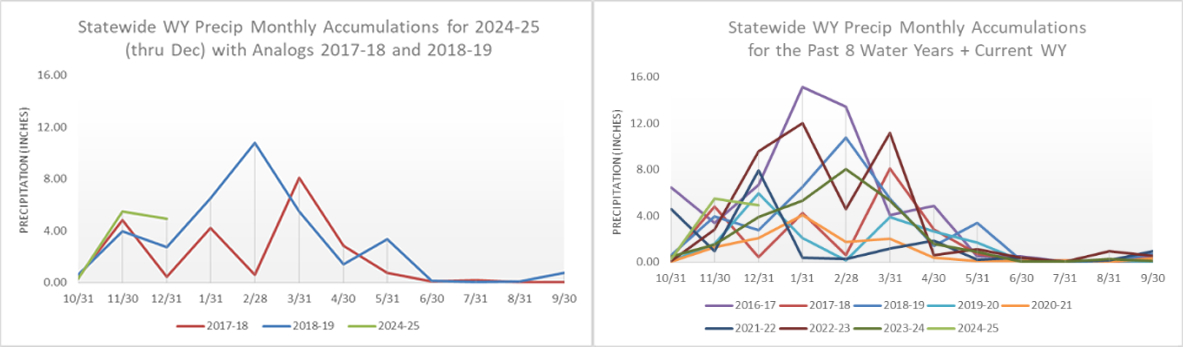
The plots below show month-by-month precipitation totals for the analog years (left) and the past 8 years (right). The analog years recorded drastically different monthly totals, with 0.62” of precipitation for the state in February 2017-18 and 10.78” in February 2018-19. Looking at the past eight years of data, February has demonstrated considerable variability, occasionally delivering some of the most significant precipitation of the water year despite being the shortest month.
Based on January’s dry conditions and CAP forecast’s exceptional track record, we anticipate significant precipitation in the months ahead. We expect this based upon:
- The Gap Between Observed and Forecasted Totals: Statewide precipitation through December remains at just 35% of average - well below the CAP forecast's lower bound of 90%.
- Analog traces: Water year’s 2017-18 and 2018-19, while ultimately yielding different final totals, had cumulative December-March precipitation of 13.36” and 25.50”, respectively. So far, the current water year has recorded just 4.91”.
- Dry January: Preliminary data from California Water Watch imagery and precipitation traces from the 8-, 5-, and 6-station indexes confirm that January has been notably dry. This suggests that, if our CAP forecast continues to perform as it has in the past, the gap between current accumulation and the forecasted water year total would close in the remaining months of the water year.
- Near-Term Forecasts: Outlooks from the Climate Prediction Center (CPC) and short-term forecasts for incoming atmospheric river activity suggest an increased likelihood of significant precipitation for California. Recent projections indicate a strengthening atmospheric river could bring significant precipitation in early February.
1 https://www.latimes.com/california/story/2025-01-04/southern-california-officially-enters-drought-as-forecast-remains-bone-dry
