Monthly Updates: Precipitation Taper
April delivered a meaningful late-season boost to precipitation across much of California. May, however, marked a return to the more typical seasonal pattern.
To place May in historical context, we use California's long-running 8-, 5-, and 6-station precipitation indices. Unlike some operational datasets whose historical values may be revised over time, these indices provide a consistent historical record that is well suited for comparing current conditions to climatology.
For the month of May, the indices show:
- Northern Sierra (8-station index): 1.4 inches observed versus a normal of 2.8 inches — 50% of normal
- San Joaquin Basin (5-station index): 0.6 inches observed versus a normal of 2.1 inches — 29% of normal
- Tulare Basin (6-station index): 0.6 inches observed versus a normal of 1.3 inches — 46% of normal
While May precipitation fell short of historical averages, this outcome is not unusual as California transitions into its dry season. With climatological precipitation declining rapidly during late spring, the below-normal totals had a relatively modest impact on overall water year accumulation.
Analog Update
At the start of the water year, we noted similarities in key model indices between the current year and water years 2018–19 and 2024–25. We have continued to monitor these analogs throughout the season.
The charts below show precipitation accumulation traces for the 8-, 5-, and 6-station indices, with the current year highlighted in bold blue and the analogs in light blue and red. The red boxes highlight the time period from last month’s report through May 31.
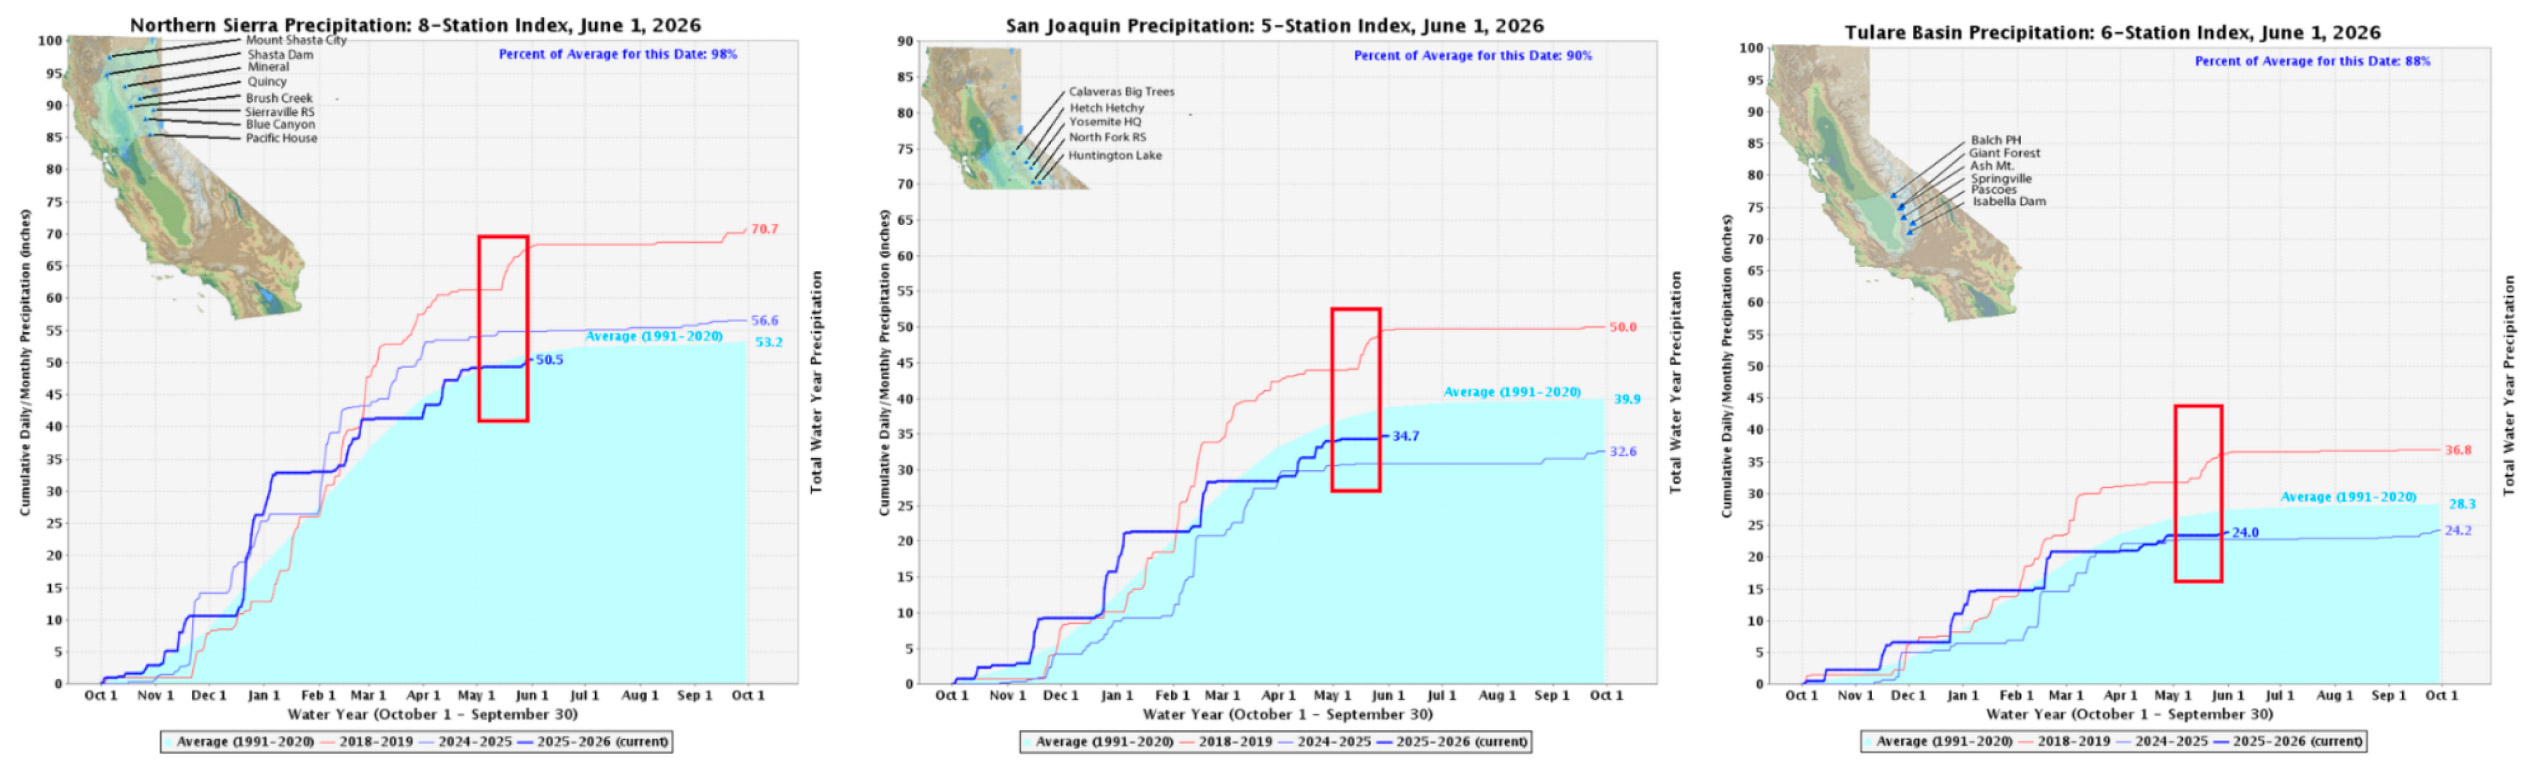
Following a wet April, precipitation slowed across all three regions. In the Northern Sierra, total accumulation increased by a mere 1.4 inches to 50.5 inches. The current WY trace remains just below both analog years, near the average.
In the San Joaquin basin, accumulation rose by approximately 0.6 inches to 34.7 inches, keeping the current year between the two analog traces.
Similarly, in the Tulare Basin, totals increased 0.6 inches to 24 inches. The current Tulare trace also sits between the analog years.
20,000 Foot View
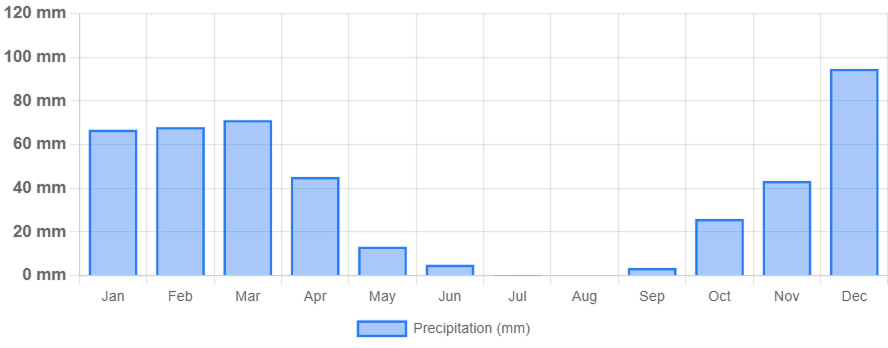
As we enter June, the second month of California’s dry season (e.g. see Sacramento’s climatology below), the 2025–26 water year is on track to verify for the 10th consecutive year. Despite considerable month-to-month variability, including a record-dry March followed by an unusually wet April, water year precipitation across the Core Supply region currently falls between 94.2% (NWS) and 98.0% (GG Weather) of normal, placing conditions within the forecasted range (95–115% of normal).
In California’s dry season, precipitation events become less frequent and contribute progressively less to annual totals. While additional precipitation remains possible through June and even into the summer months, significant changes to the overall water year outcome become increasingly unlikely.
Looking ahead, one development attracting considerable attention is the potential emergence of a "Super El Niño" later this year. While not an official meteorological classification, the term is commonly used when sea surface temperature anomalies in the equatorial Pacific reach approximately +2.0°C or greater. Only a handful of such events have occurred since 1950.
Although a developing El Niño would not directly impact the verification of the current water year forecast, continued warming of the tropical Pacific could modestly increase the likelihood of late-summer and early-fall precipitation events across portions of California.
Reservoir Status
This section highlights four reservoirs; additional information on inflow forecasts and observed inflow-to-date can be found within the CRAFT section of the portal.
Starting in February, the Department of Water Resources provides the Bulletin 120 (B-120) forecasts, reflecting evolving hydrologic conditions based on observed precipitation and historic inflows. The B-120 offers a dynamic, regularly updated perspective as the season progresses, while CRAFT delivers a single, fixed-range inflow forecast issued each November—well ahead of the B-120’s initial February release.
The plots below show CRAFT inflow forecasts (light blue, horizontal rectangle) for four featured reservoirs alongside the state’s evolving B-120 forecasts (orange, vertical bars) for the same reservoirs. The observed inflow (through May 26) is shown in green.
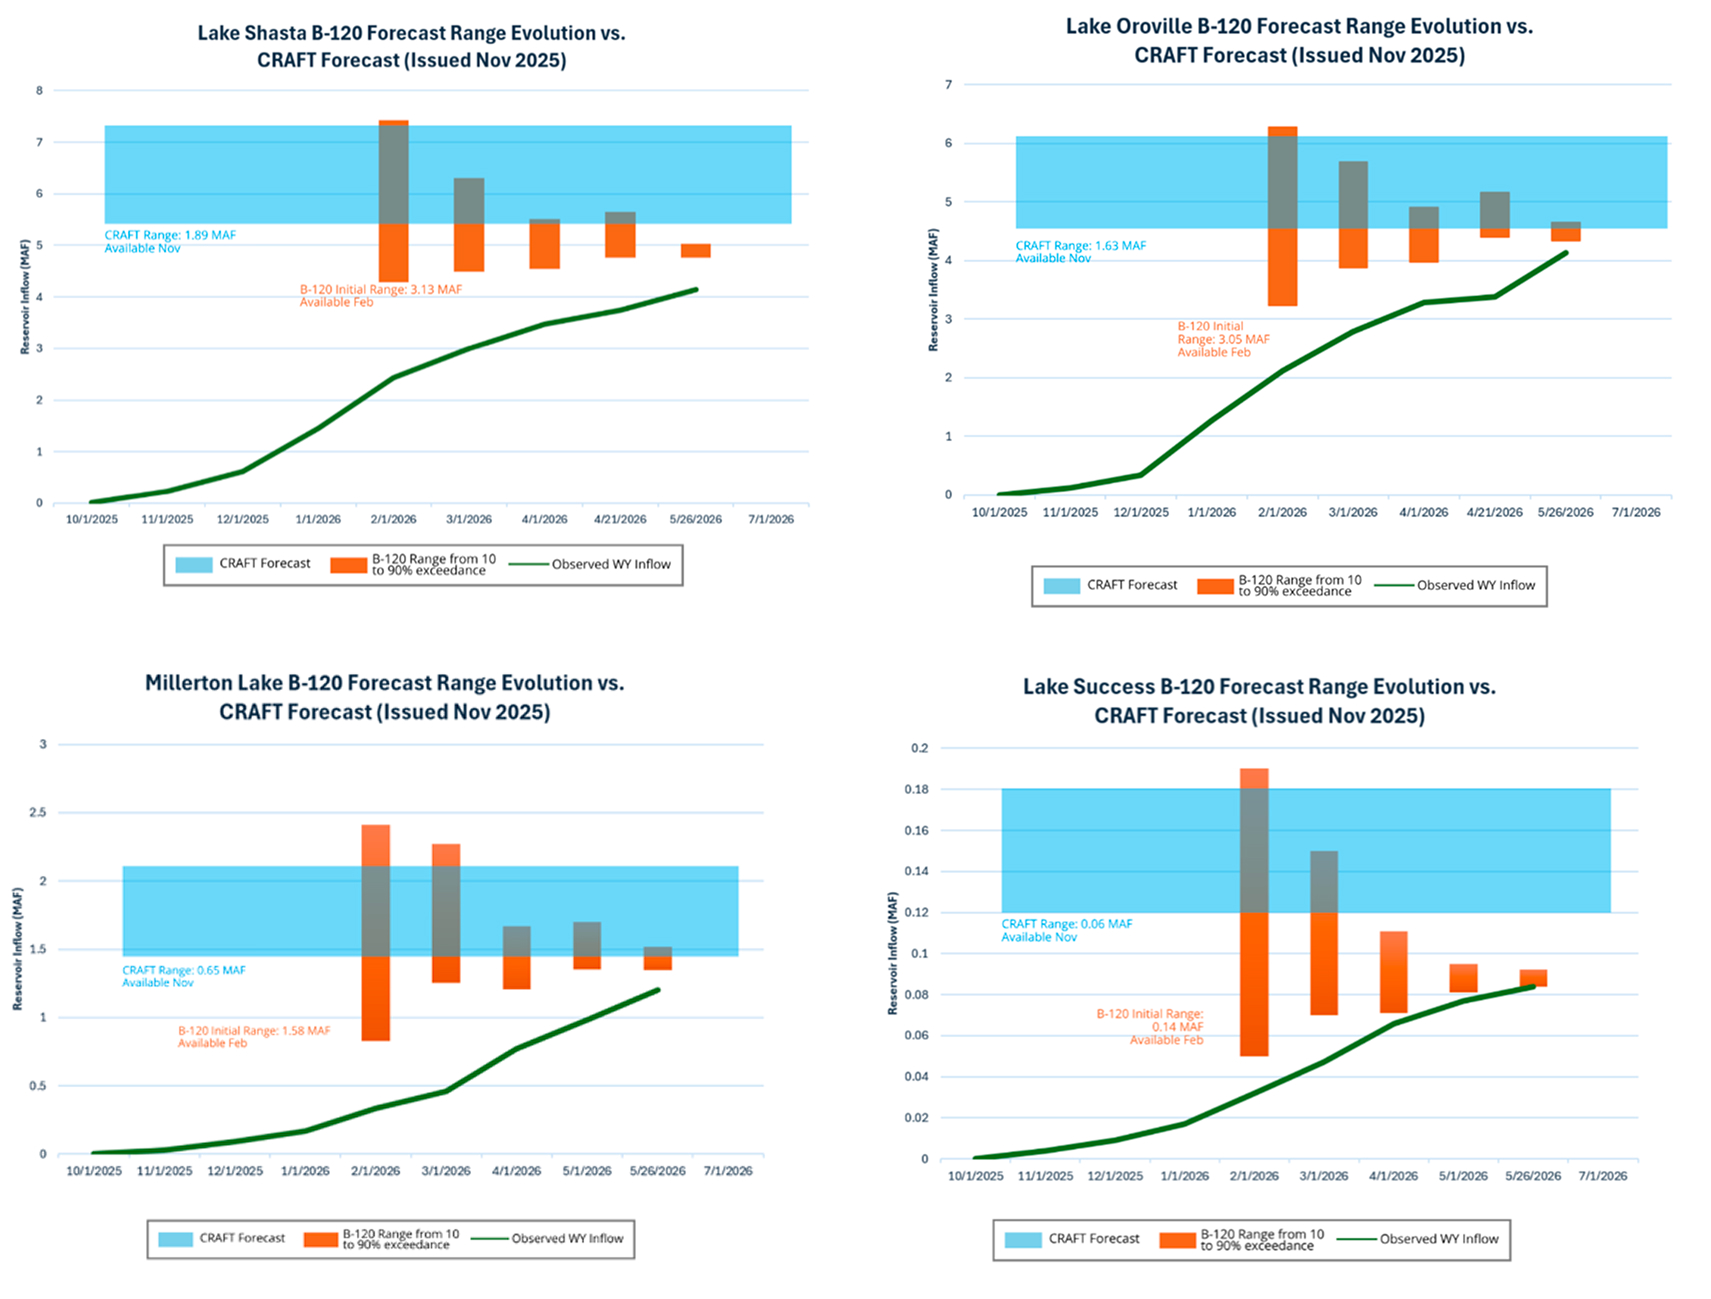
We will continue tracking the progress of the observed inflow toward our fixed CRAFT forecast.
