Monthly Update: Dry March, but on Track
Visualizing the Precipitation
California Water Watch (CWW) precipitation maps, with CAP regions overlaid, illustrate water-year-to-date totals as a percent of average through last month’s update on March 9 (top) and through April 4 (bottom), with statewide statistics included alongside each map.
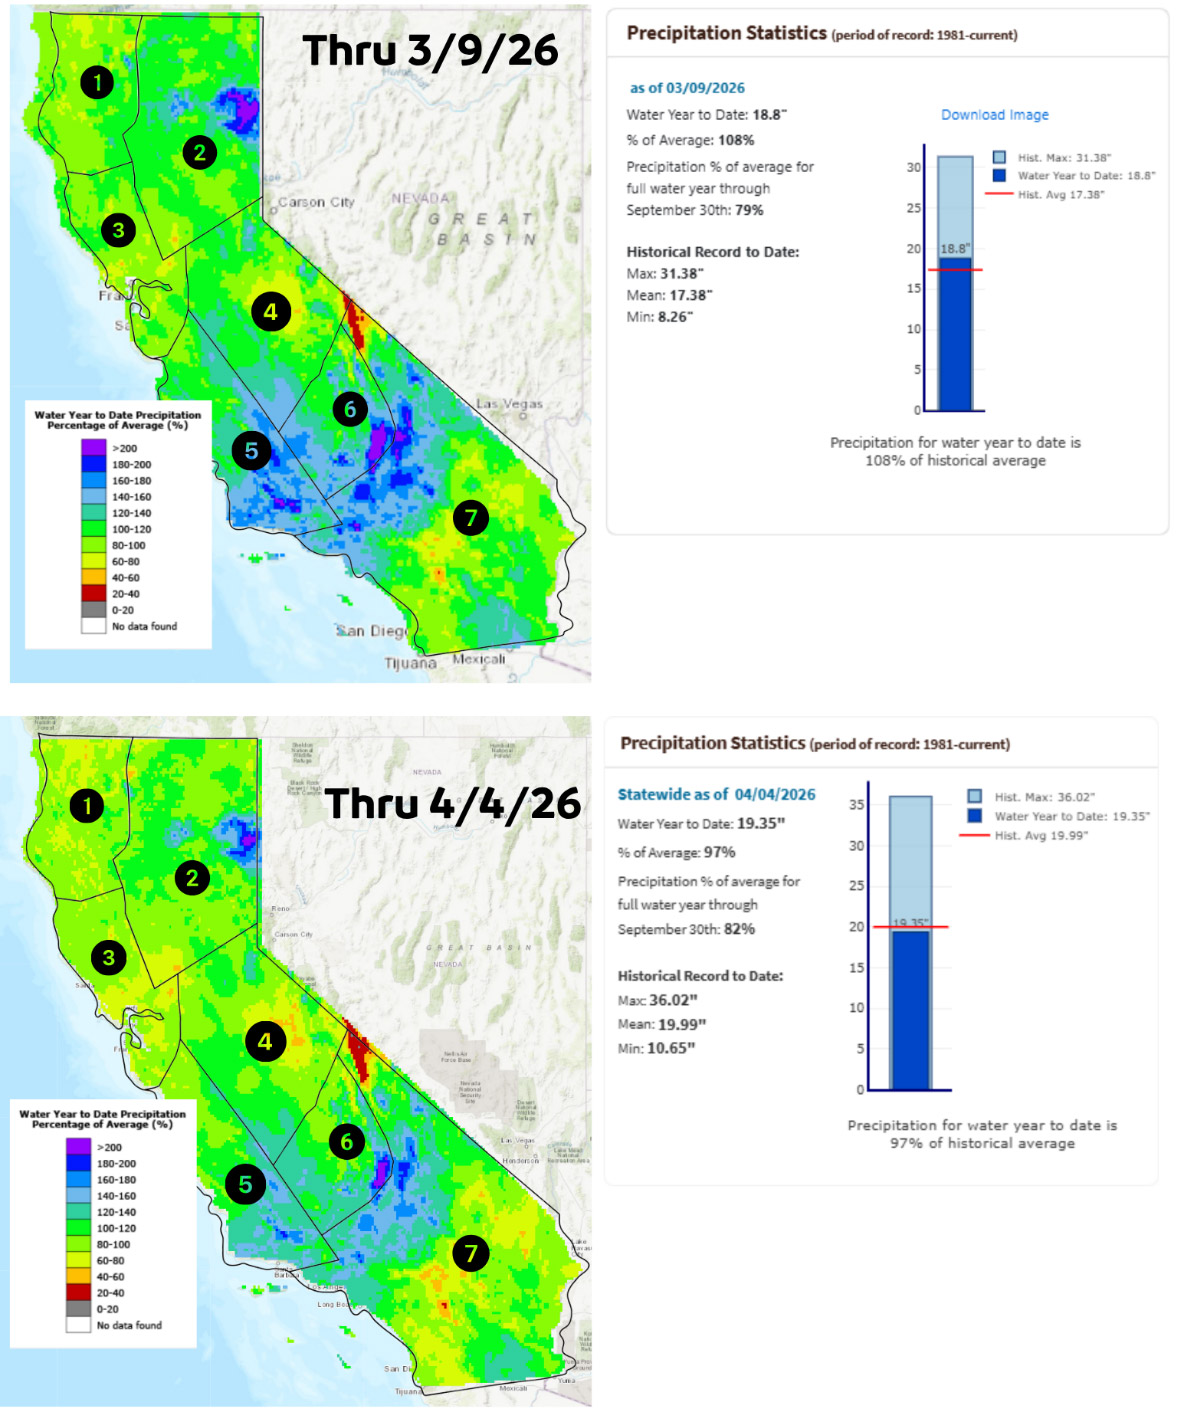
On March 9, statewide water year-to-date precipitation stood at 18.8 inches (108% of average). By April 4, totals had increased to 19.35 inches, but the percent of average dropped to 97%, as typical seasonal accumulation outpaced the observed precipitation.
This shift is clearly reflected across the Core Supply region (Regions 2, 4, and 6). In March, much of this area appeared in green to light blue, indicating above-average precipitation. By early April, the color scale has shifted toward green and yellow, reflecting a moderation back toward near-normal conditions.
Analog Update
At the start of the water year, we noted similarities in key model indices between the current year and water years 2018–19 and 2024–25. We have continued to monitor these analogs throughout the season.
The charts below show precipitation accumulation traces for the 8-, 5-, and 6-station indices, with the current year highlighted in bold blue and the analogs in light blue and red. The red boxes highlight the time period from last month’s report through April 5.
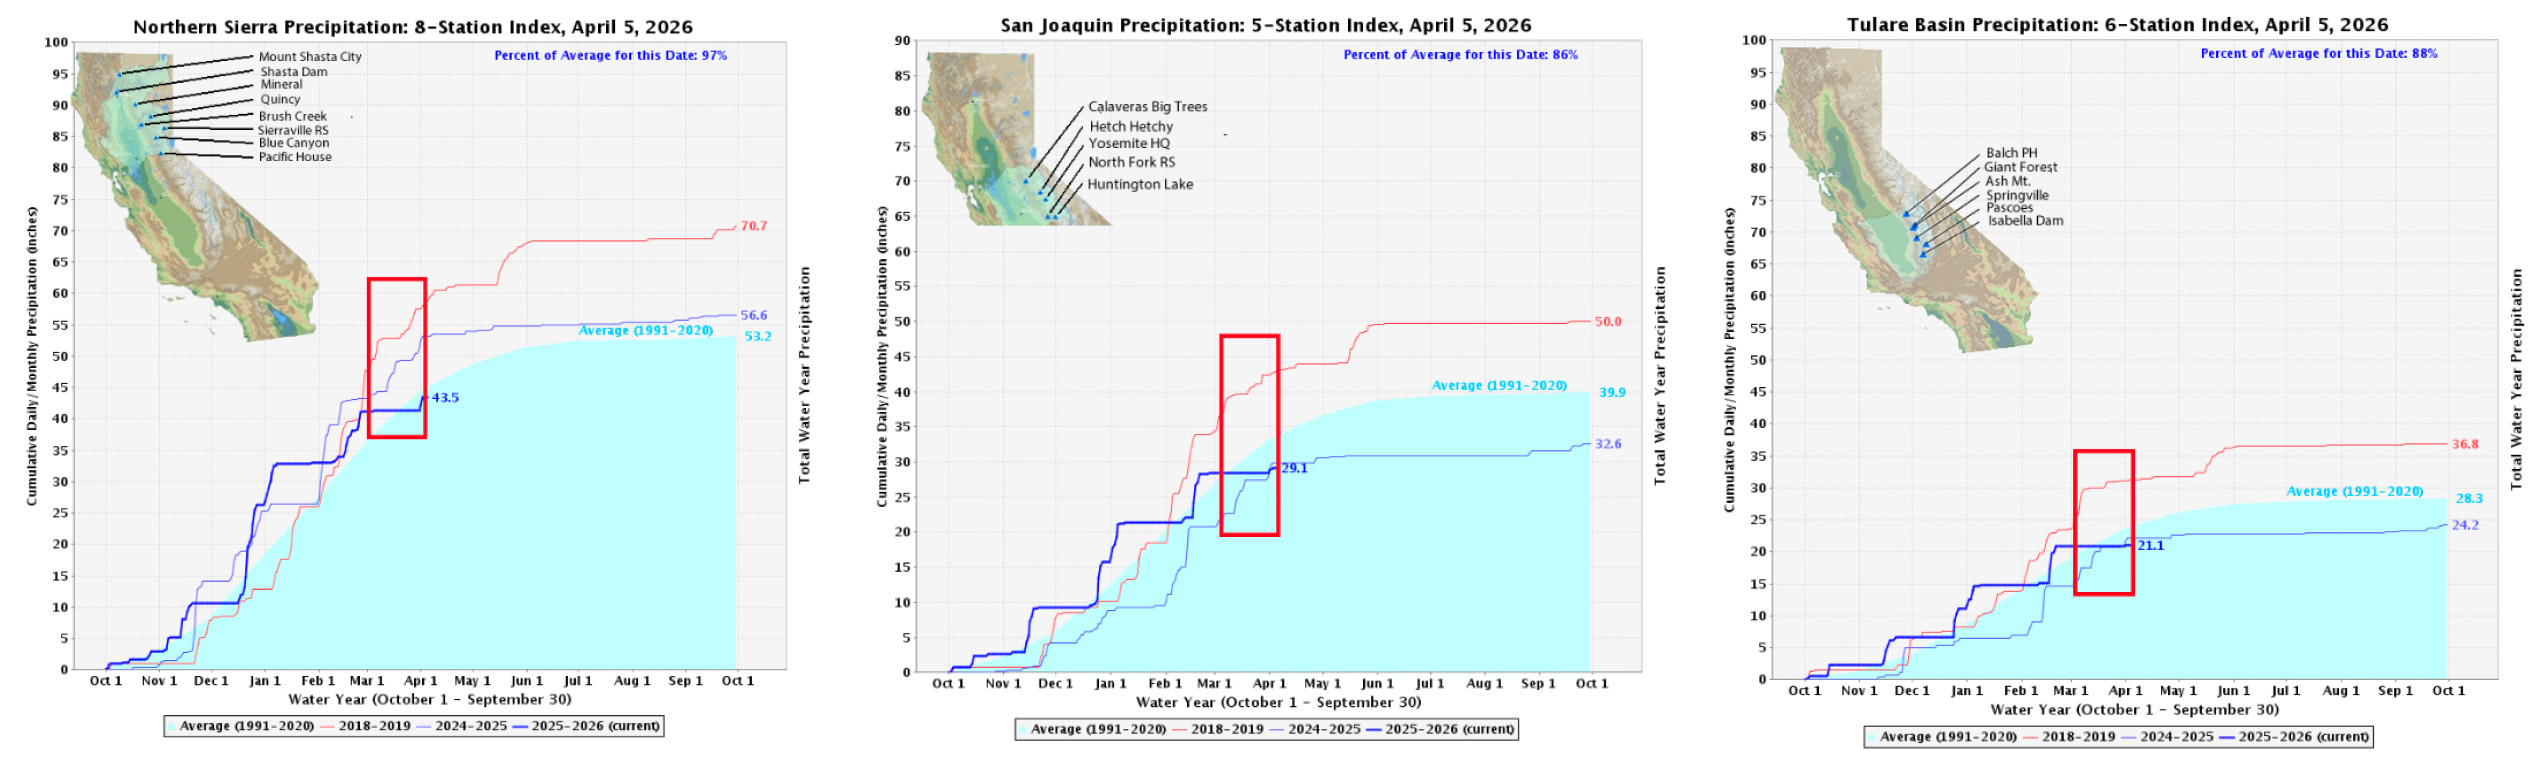
Across all three regions, precipitation has been nearly flat since the start of March, aside from a small bump in the first few days of April. This quiet period has left the traces slightly below those of both analogs across all three basins.
Through April 5, current accumulation totals for each region (43.5, 29.1, and 21.1 inches, respectively) equate to 82%, 73%, and 75% of average for the total water year. Why do these numbers differ from the Core Supply accumulation reported on the dashboard homepage?
The 8-, 5-, and 6-station indices are composed primarily of higher-elevation stations and are therefore more representative of snow-dominated precipitation regimes. This year, however, has been characterized by predominantly warm storm events, with a greater share of precipitation falling as rain at lower elevations. As a result, these indices slightly under-represent total precipitation.
In contrast, the stations used for forecast verification span upper elevations, foothills, and valley locations—providing a more complete picture of total precipitation and a more representative measure of ground truth.
Reservoir Status
This section highlights four reservoirs; additional information on inflow forecasts and observed inflow-to-date can be found within the CRAFT section of the portal.
Starting in February, the Department of Water Resources provides the Bulletin 120 (B-120) forecasts, reflecting evolving hydrologic conditions based on observed precipitation and historic inflows. The B-120 offers a dynamic, regularly updated perspective as the season progresses, while CRAFT delivers a single, fixed-range inflow forecast issued each November—well ahead of the B-120’s initial February release.
The plots below show CRAFT inflow forecasts (light blue, horizontal rectangle) for four featured reservoirs alongside the state’s initial three B-120 forecasts (orange, vertical bars) for the same reservoirs. The observed inflow is shown in green.

By visualizing both forecast approaches on the same timeline, it is evident that CRAFT complements existing state guidance—filling a critical early-season need for inflow estimates while aligning with later updates from B-120. Together, these tools provide a more complete picture of water year expectations for California’s reservoirs.

We will continue tracking the progress of the observed inflow toward our fixed CRAFT forecast.
