Monthly Update: A Shift in the Precipitation Pattern
March brought the season to a near standstill, with precipitation accumulation flat-lined across much of California during what is typically one of the wetter months of the year. April reversed that trend. Rather than tapering off—as is more common this time of year—the pattern turned active, delivering steady gains and re-accelerating water year progress across the state.
So how wet was April in a historical context? The answer depends on where you look.
One of the most consistent reference points is the 8-, 5-, and 6-station indices. Through April 28, these indices show that April was notably wetter than normal across much of the Core Supply region.
- In the Northern Sierra (8-station index), April totals reached 7.8 inches, compared to a normal of 4.3 inches—181% of normal.
- In the San Joaquin region (5-station index), totals were closer to average, with 2.5 inches observed, roughly in line with the 2.5-inch normal.
- In the Tulare Basin (6-station index), 5.6 inches were observed versus a normal of 3.5 inches—160% of normal.
Taken together, these results show that while April did not produce uniformly above-normal precipitation across all regions, it delivered a meaningful late-season boost—particularly in the northern and southern portions of the Core Supply area.
Visualizing Recent Precipitation
This late-season boost was driven in part by a series of storms in the final week of April.
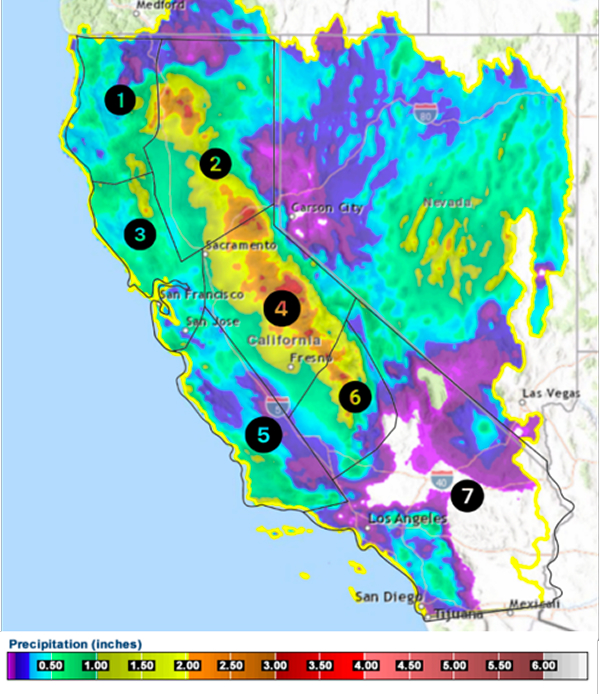
The adjacent map shows total observed precipitation (in inches) over the seven days from April 21-28, with ALICE Regions 1–7 overlaid. This product is generated by the California-Nevada River Forecast Center (CNRFC) and represents a blended analysis of radar data, rain gauge observations, and satellite inputs. These data are quality-controlled and combined into a gridded dataset, providing a spatially continuous depiction of where precipitation occurred and how much fell.
Totals represent liquid-equivalent precipitation, capturing both rainfall and snowfall.
Precipitation was produced by a series of weak, progressive troughs moving into the North-Central California coast and then inland. This resulted in widespread but moderate totals, with the strongest precipitation from the Central Valley into the Sierra Nevada, where higher elevations saw localized orographic enhancement—particularly in Region 4.
Overall, April was marked by an uptick in precipitation across the state, but totals continue to vary depending on location and elevation.
Analog Update
At the start of the water year, we noted similarities in key model indices between the current year and water years 2018–19 and 2024–25. We have continued to monitor these analogs throughout the season.
The charts bellow show precipitation accumulation traces for the 8-, 5-, and 6-station indices, with the current year highlighted in bold blue and the analogs in light blue and red. The red boxes highlight the time period from last month’s report through April 27.
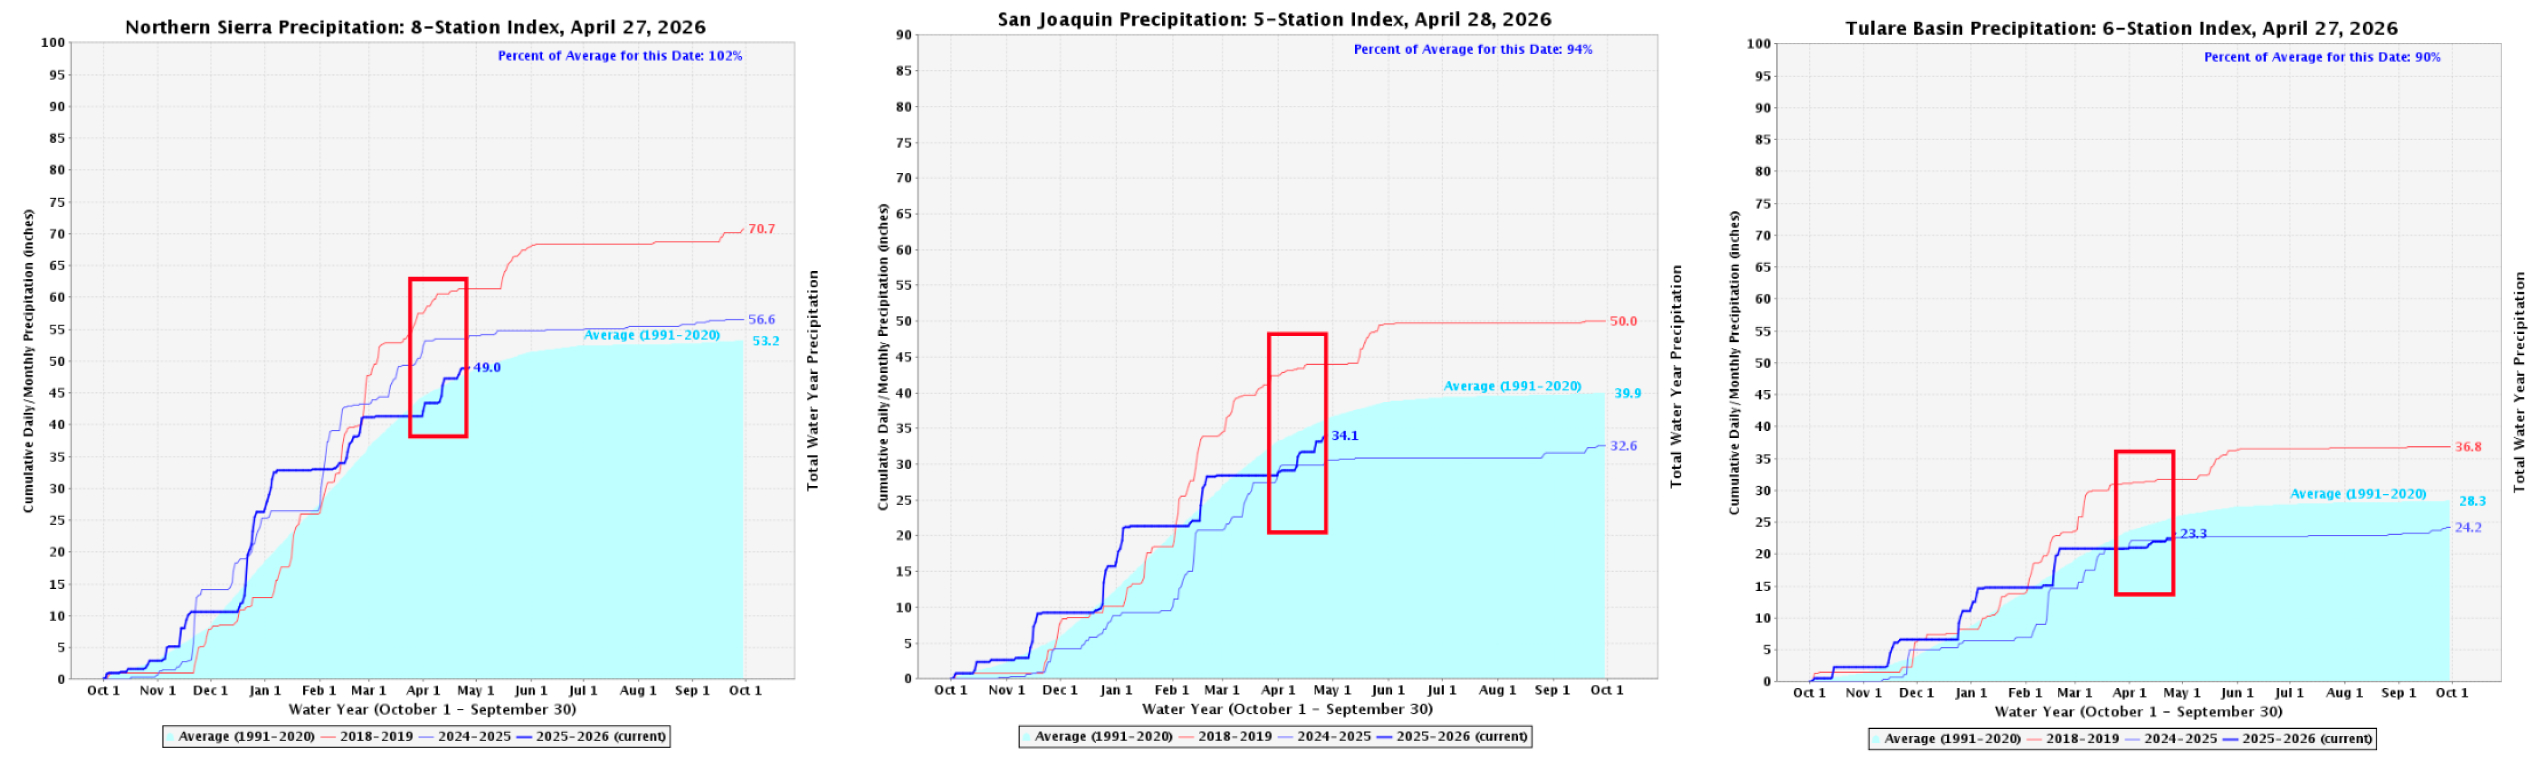
Following a largely stagnant March, April delivered a meaningful increase in precipitation across all three regions, shifting the position of the current year relative to the analogs.
In the Northern Sierra, total accumulation increased by more than 6 inches to 49.0 inches. While this represents a substantial gain, the current trace remains just below both analog years.
In the San Joaquin basin, accumulation rose by approximately 5 inches to 34.1 inches, bringing the current year into the space between the two analog traces.
A similar shift occurred in the Tulare Basin, where totals increased to 23.3 inches. The current trace now also sits between the analog years after trailing both in early April.
