March and Beyond: The Elephant in the Room
Back in the fall, we opened our initial CAP forecast with a familiar parable: a group of blind men encounters an elephant, each describing it differently based on the part they touch. One thinks it’s a snake, another a tree, another a rope. It was our way of illustrating how focusing on just one part of the water year (like climate drivers or a flurry of atmospheric rivers) can lead to an incomplete picture. Amid a noisy landscape of varied perspectives, CAP forecasted a “normal-looking elephant” for water year 2024-25.
Now, as we enter the final stretch of the water year, there’s a new elephant in the room: Will the CAP forecast verify?
According to CWW data through 04/30/2025, statewide precipitation sits at approximately 90% of WY normal. This year the Core Supply region has run 2–3% wetter than the state as a whole, placing it around 92.5%, comfortably within CAP’s projected range of 90–110%. Climatologically, we would expect this number to grow several % points over the remaining months of the water year.
Most of the elephant is within view, and it’s looking a lot like the “normal-looking elephant” we forecasted back in the fall.

A Closer Look
The Northern Sierra, San Joaquin, and Tulare Basin precipitation indices for Water Year (WY) 2024-25, along with two analog years, are shown below. The pink box highlights the month of March. A few key observations:
- Since March 1, precipitation totals across all three regions have seen gains, though of a more modest magnitude compared to February.
- Comparing the current water year trace to the historical average (as shown in the light blue shaded region), a pronounced north-to-south precipitation gradient stands out—consistent with the precipitation patterns also visible in NWS data. While regional differences are not uncommon, the size of this year’s disparity is more pronounced than in either of the CAP model’s selected analog years. In those years, all three regions ended the water year on the same side of average, with a much narrower spread between them:
- In WY 2017-18, Northern Sierra ended at 77.1% of normal, San Joaquin at 74.4%, and the Tulare Basin at 63.3%.
- In WY 2018-19, Northern Sierra came in at 133%, San Joaquin at 125%, and Tulare at 130%.
- By contrast, the current water year (as of May 1) shows Northern Sierra at 111% of average to date, while San Joaquin lags behind at 71%, and Tulare sits at 87%. This divergence is not only visible, it’s significant, both in absolute terms and relative to the analogs.
- Note: The “Percent of average to this date” shown in the top right of each chart refers to how much precipitation has fallen compared to the typical accumulation by this point in the season—not a percentage of the full water year.
This year’s pronounced regional difference echoes signals we saw in the model’s output back in the fall (see R&D discussion in March 2025 Insights). While our primary CAP forecast provides a statewide precipitation outlook, we have been actively evaluating the model’s ability to resolve and anticipate regional gradients, like the one we observed between our Half Moon Bay and Modesto sites in October. This gradient is evident in the 8-, 6-, and 5-station indices, reinforcing what the model initially indicated. A difference of this magnitude has real implications depending on your location, and reinforces the value of continuing to test and refine the model’s capability in forecasting spatial variability.

Basin Precipitation Distribution Relative to CAP Forecast Band
The heat map below shows the percentage of NWS climate sites in each region relative to the CAP forecast band (e.g., 90–110%), providing a snapshot of how basin precipitation aligns with the forecast through the end of March. Darker shades represent a higher percentage of sites within that band, offering a visual cue of both regional spread and concentration.
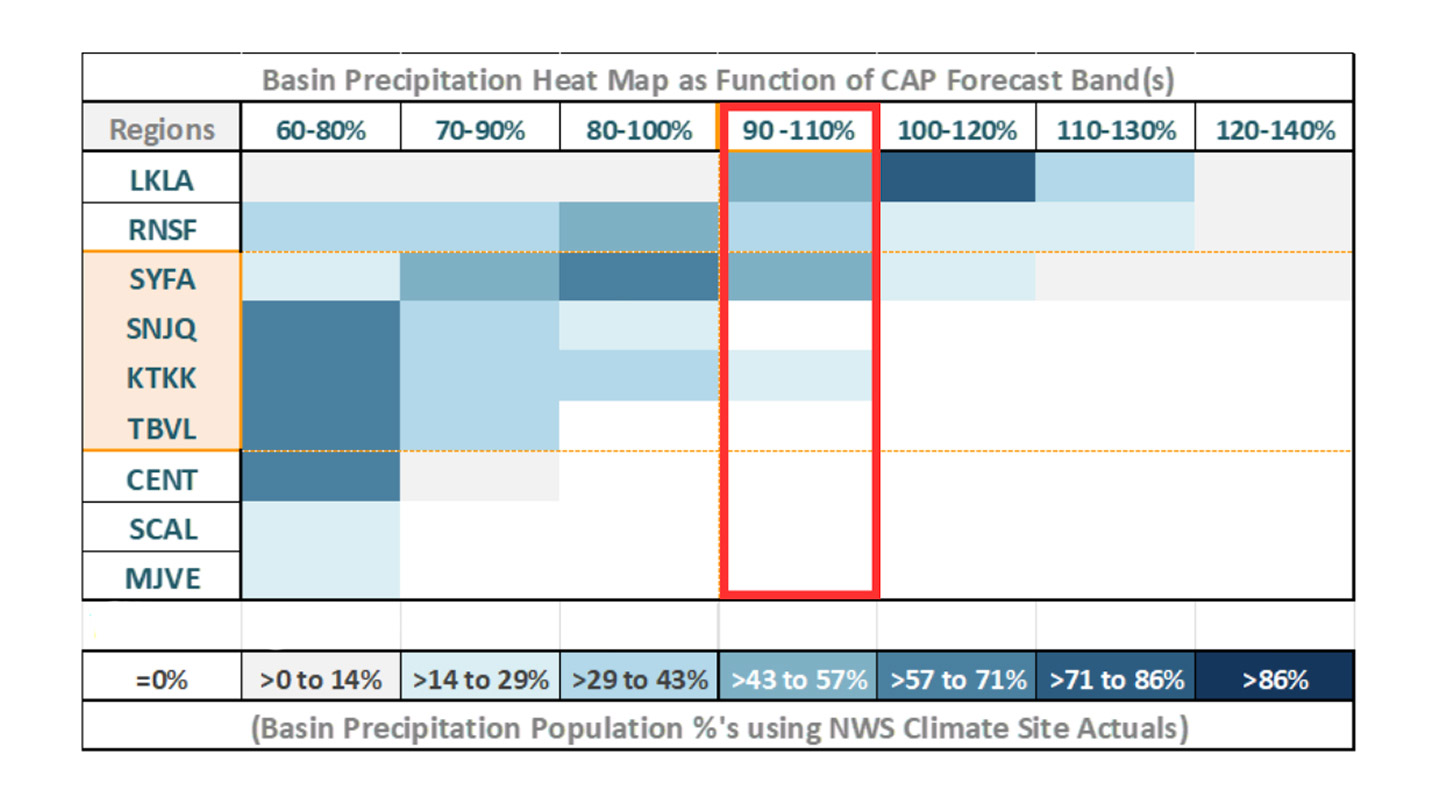
The north-to-south gradient is especially visible here, with Northern California basins (LKLA, RNSF, and SYFA) clustering in higher forecast bands while Central and Southern basins (SNJQ, TBVL, CENT, SCAL, MJVE) cluster almost exclusively in the lower forecast buckets, with some basins showing no stations exceeding 80% of normal.
This heat map incorporates NWS climate site observations through March 31. With April precipitation totals, we anticipate a rightward shift in station distribution.
