January Slows, but the Water Year Remains on Track
After a blockbuster end to 2025, January appears more subdued by comparison. But is this reason for concern?
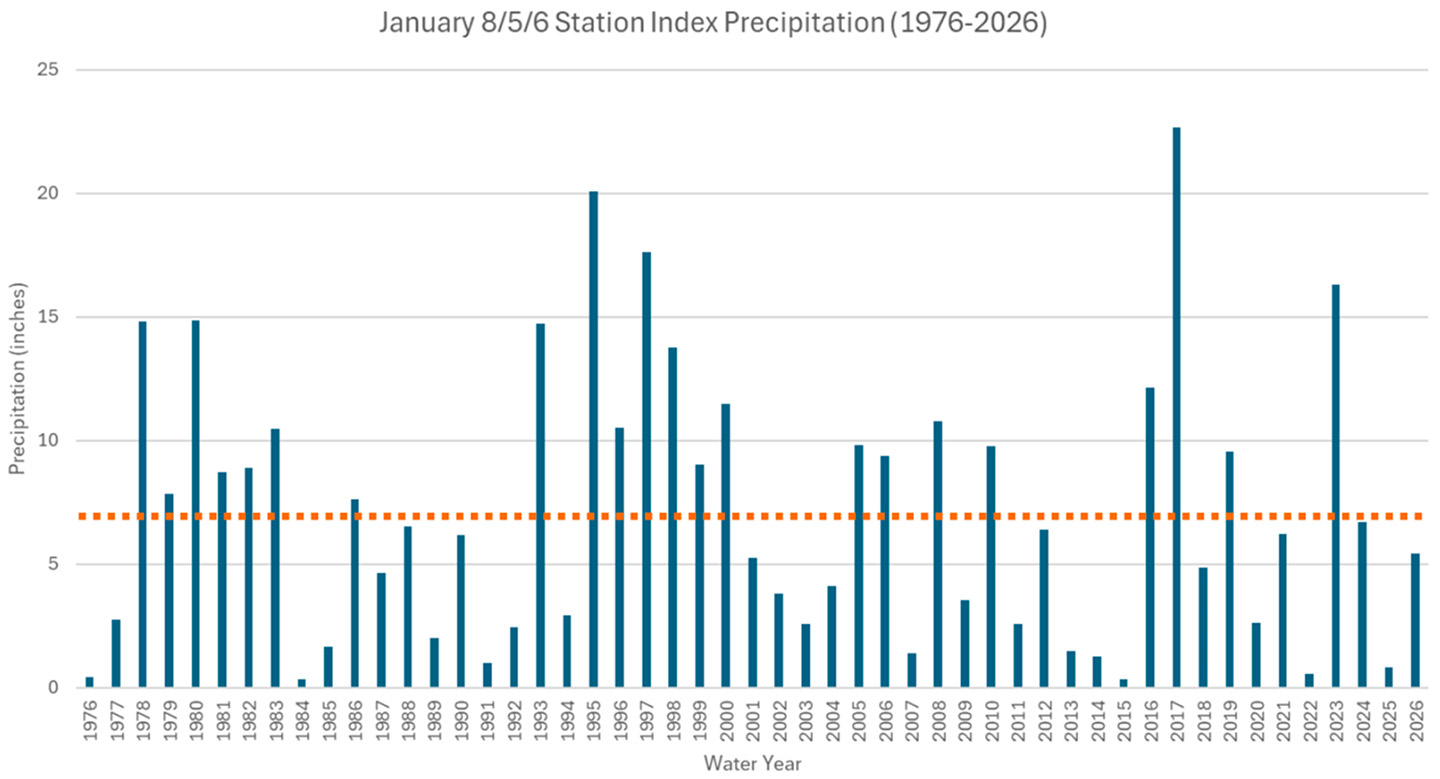
As shown in the histogram below, January precipitation for the combined 8/6/5 station indices exhibits substantial historical variability, with totals ranging from near zero to more than 20 inches from 1975-present. While extreme January outcomes tend to draw attention, most years cluster near the long-term average of 7.09 inches, highlighted by the dotted orange line that runs through the densest portion of the distribution. January 2026 totaled 5.41 inches, placing it modestly below the long-term mean but well within the historical mid-range and far from the dry tail of the distribution. This level of accumulation reflects a climatologically typical January. Historically, drier-than-average Januaries have resulted in both wet and dry water years. We know January alone cannot determine what the full water year will bring, but it never hurts to be reminded.
So what shall we conclude?
The CAP model forecasts 39.75 to 48.11 inches for the total water year, and through the end of January, the Core Supply sits at 24.17 inches, leaving roughly 15 inches to reach the lower end of the forecast range. Climatologically, the region receives an average of 20.7 inches from February through the end of September. This means that even a slightly “below average” February and beyond would place the water year within the forecast range.
Spatial Distribution of Precipitation
California Water Watch (CWW) precipitation maps, with CAP regions overlaid, illustrate water-year-to-date totals as a percent of average through January 1 (left) and January 31 (right), with statewide statistics included alongside each map.
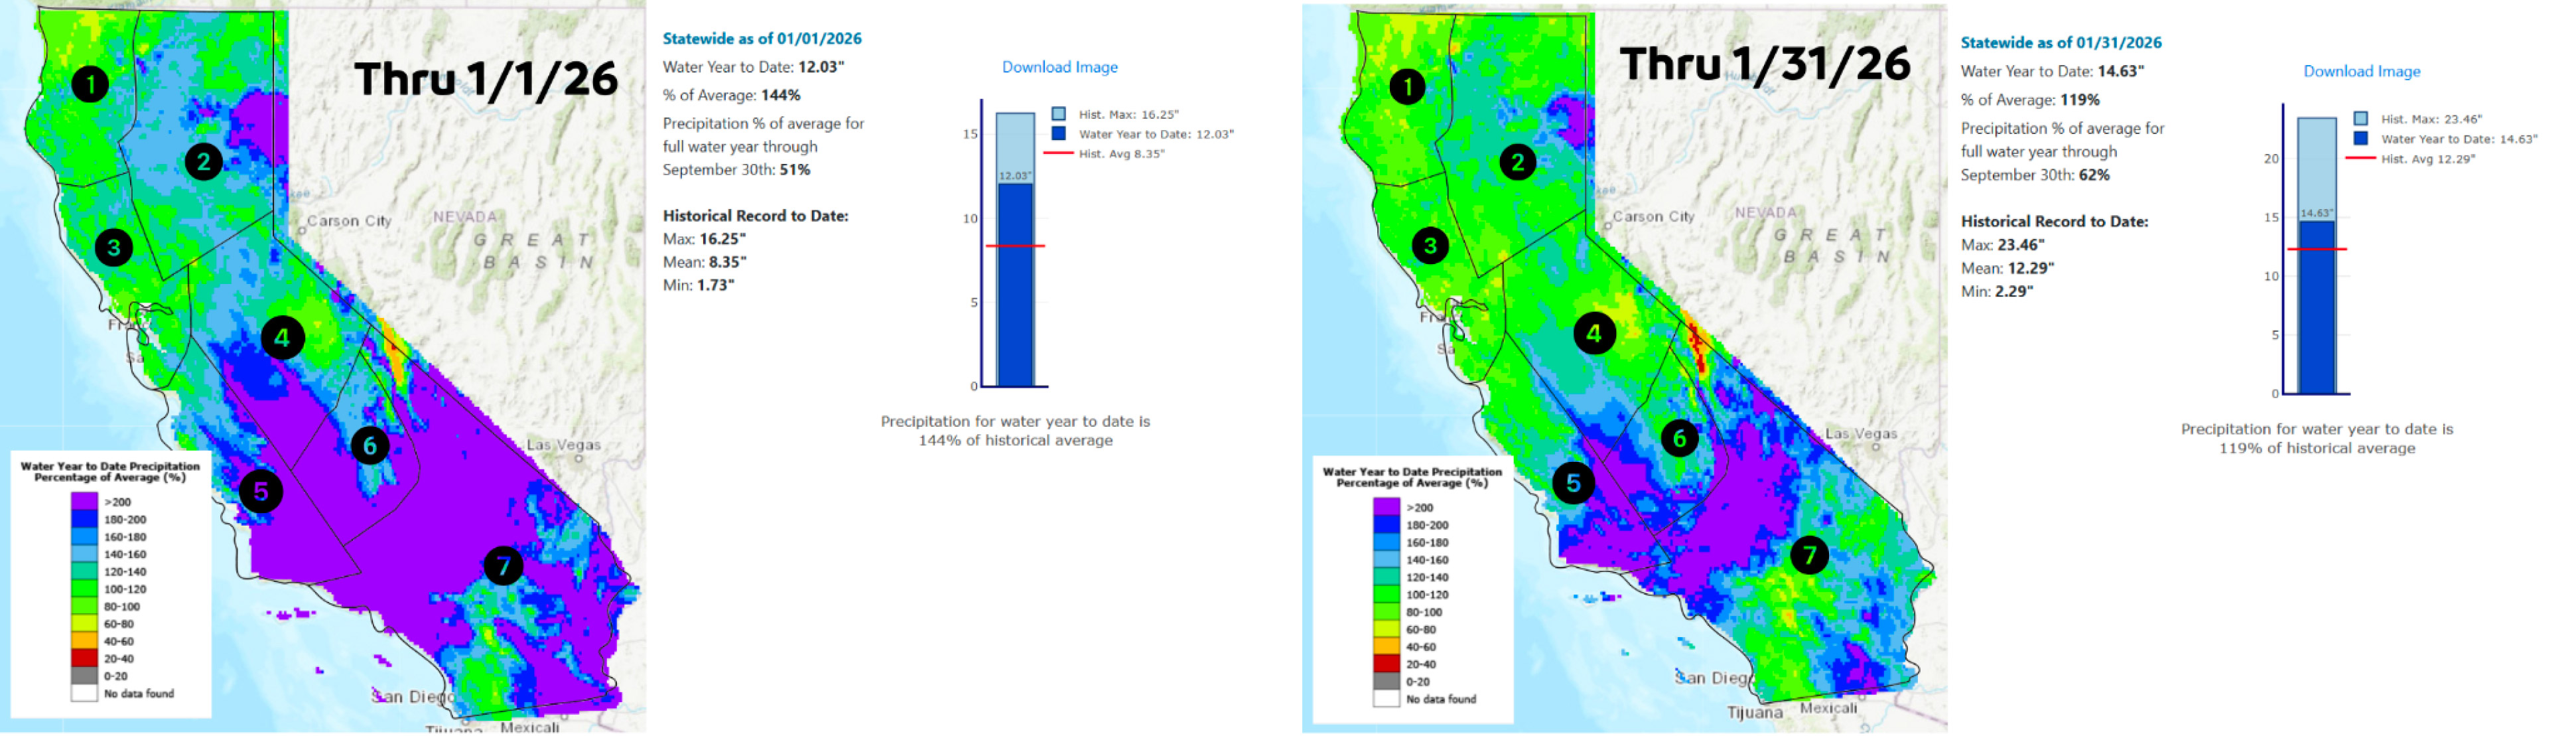
As of January 1, the state was emerging from a series of late-December atmospheric rivers, sitting at 144% of average-to-date. Much of the state was at or above normal with parts of CAP regions 4-7 exceeding 200% of normal through January 1.
Through the end of January, there is a relative decline in percent-of-average precipitation, reflecting the lack of additional precipitation following the early-month plateau. Despite this lull, statewide precipitation was 119% of average through January 31, still well above normal thanks to early-season storms.
Analog Comparison
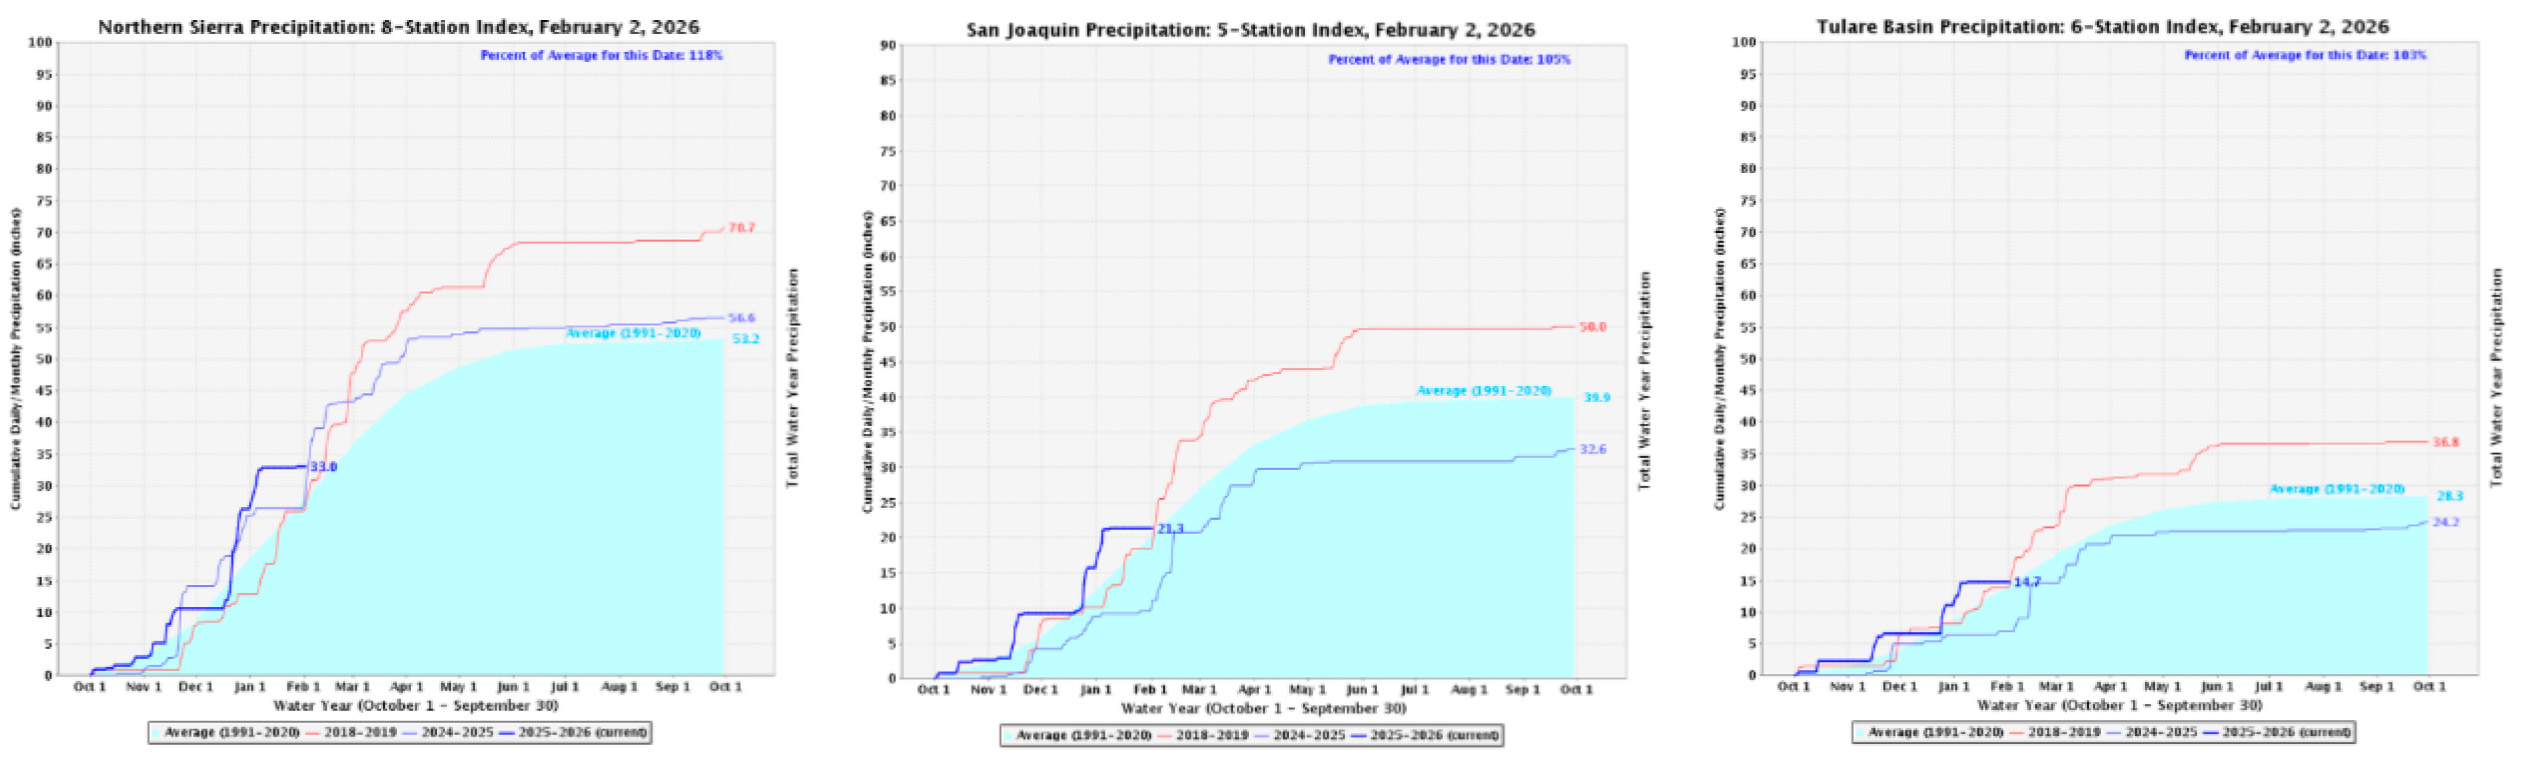
The charts below show the precipitation accumulation traces for the 8-, 5-, and 6-station indices, with the current year in bold blue alongside the analogs. In January, the 2025-26 trace flattened out after the conclusion of the latest round of atmospheric rivers. This quiet period brought the cumulative totals closer to the trajectories of the two analog years. Interestingly, last January exhibited a similar plateau in accumulation – but without the early boost.
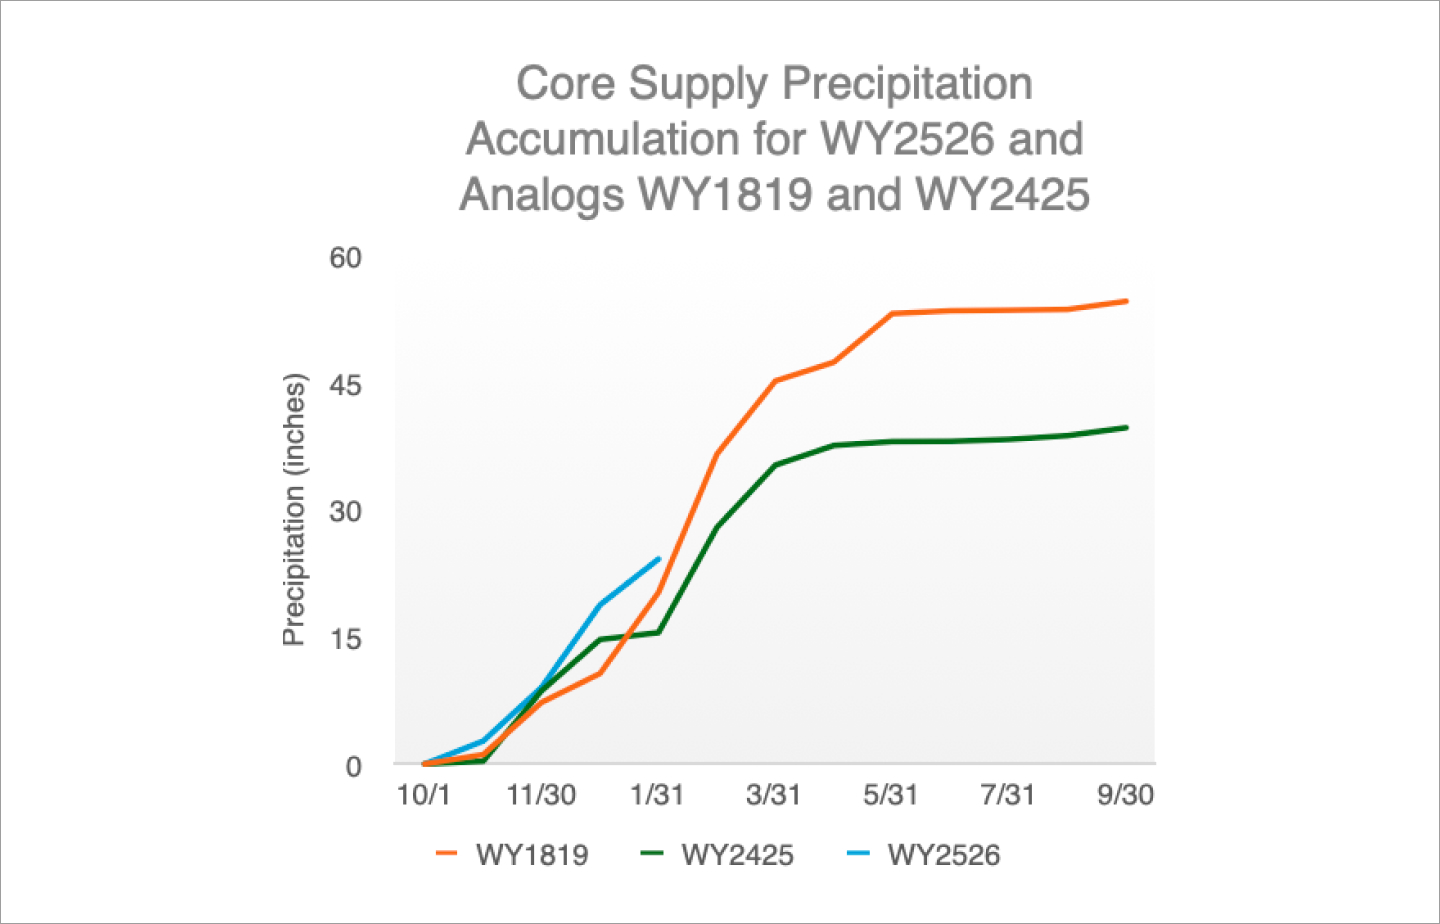
The image below features the Core Supply precipitation accumulation (combined 8/5/6 station indices) for analog water years 2018-19 and 2024-25 alongside the present year. While early-season precipitation placed the current water year (blue) ahead of both analogs, January brought a moderation in accumulation, causing the curve to bend back toward the analog trajectories.