Insights on the December 20-29 Precipitation Event
Between December 20 and 29, 2024, California experienced a series of atmospheric rivers that brought substantial precipitation, with forecasts predicting 6 to 14 inches over Northern California during this period.
These storms resulted in localized flooding, with some areas in Northern California receiving over a foot of rain. Overall, the late December storms made a significant contribution to California’s water year (WY) precipitation totals.
Event Analysis
We can assess the impact of the December 20–29 storm using near real-time data from the National Weather Service. It is important to note that this data set represents only a fraction of the stations used in our monthly verification with 44 observation sites for the statewide total with only 13 of those stations located in the Core Supply region (CAP Regions 2, 4, and 6).
Due to the limited spatial distribution of these stations, this particular data set is not broadly representative and is better suited for approximating the event’s impact rather than providing precise WY precipitation totals. The figures below are preliminary and offer a rough estimate of the storm’s influence.
- Core Supply Regions: The December 20-29 event added 9.10 percentage points to the total WY precipitation accumulation, bringing the Core Supply to roughly 37% of WY normal.
- Statewide: The state as a whole gained 4.55 percentage points from December 20-29, bringing WY accumulation to roughly 20%.
We can discern regional patterns in a relative sense, but the percentages should not be taken as precise measures of precipitation received. Keeping this in mind:
Regional Highlights

In descending order of impact:
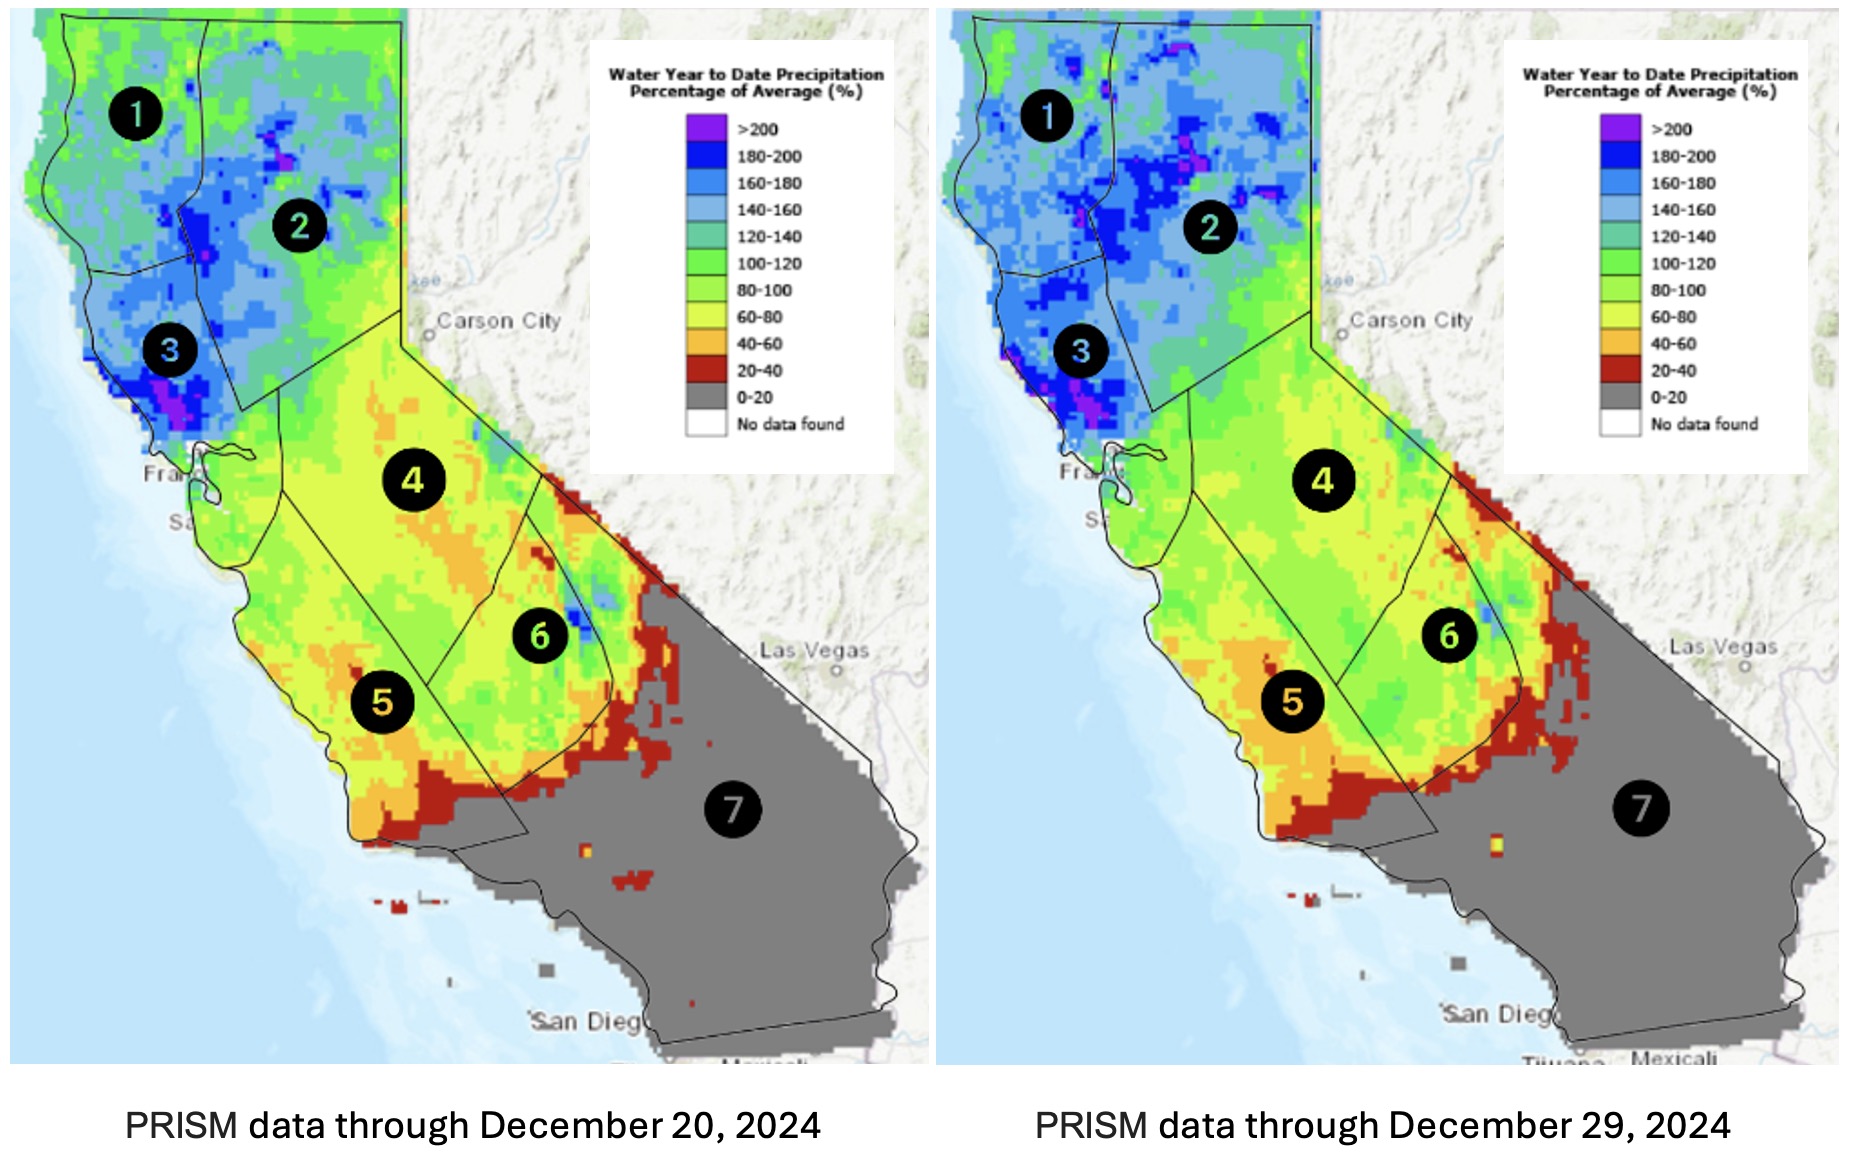
- Region 1: Although no station data was reported for the Lower Klamath region during this event, PRISM estimates (see images in the “Visual Analysis” section) indicate notable precipitation impacts. The western portions of the region, near the coastal ranges, received the heaviest precipitation, as reflected in darker blue shades, while the eastern areas saw lighter totals due to the rain-shadow effect. We will provide additional information on WY precipitation for this region in our next monthly update.
- Region 2: The Sacramento, Feather, and American region saw a large impact, with a 10.41% increase in WY precipitation from the December 20–29 atmospheric rivers.
- Region 3: The San Francisco Bay area also saw a significant increase of 9.15%, with Ukiah recording the greatest gain in the region, jumping by 13.06 percentage points. Santa Rosa added another 12.4%, reaching 75.75% of WY normal—more than 13 percentage points higher than the next nearest total of 62.20% at Red Bluff. This increase follows substantial precipitation from successive atmospheric river events in November.
- Region 4: Precipitation totals in the San Joaquin and Tulare region rose by 8.28%, with Modesto recording the highest single station gain at 10.76%.
- Region 6: The Kern and Kings region recorded a 7.23% increase in WY precipitation.
- Region 5: The Central Coast experienced a more modest 5.26% increase in WY totals.
- Region 7: Southern California recorded only trace amounts of precipitation during this event.
This breakdown highlights the variability in storm impact across the state, with Regions 1-4 seeing the most significant gains, and Region 7 remaining largely unaffected.
Visual Analysis
The images below, sourced from California Water Watch, display PRISM data for WY-to-Date precipitation as a percentage of the average. The left image captures conditions prior to the atmospheric river event (through December 20, 2024), while the right image shows conditions following its conclusion (December 29, 2024). Overlaid on these images are the approximate boundaries of the CAP regions, providing a clear view of the spatial distribution of precipitation. In Regions 1-3, the intensity and extent of blue shading reflects the significant precipitation accumulations. Region 4 shows a shift from yellow and orange to predominantly green and yellow. In contrast, changes in Regions 5 and 6 are more subtle, where precipitation totals were lower.
Northern Sierra, San Joaquin, and Tulare Basin
The 8-station, 5-station, and 6-station indices shown below provide insight into how the Dec 20-29 storm event impacted these regions. CAP’s seasonal forecast indices allow us to identify analog water years that closely resemble the current water year. These analogs (2017-18 and 2018-19) are shown alongside the current water year in each plot, with the timing of the Dec 20-29 event marked by a red bar.
All three regions experienced a notable boost in precipitation during this period. The Northern Sierra gained close to 7 inches, the San Joaquin slightly more than 3, and the Tulare around 1 inch. WY totals give perspective to these numbers:
- The 8-station WY average is 53.20 inches; an approximate gain of 7 inches represents ~13%.
- The 5-station WY average is 40 inches; a gain of just over 3 inches is ~8%.
- The 6-station WY average is 28.3 inches; a gain of 1 inch is ~3.5%.
While these event totals are approximate and derived from the plots, they provide a sense of the event’s impact. We will take a closer look at these indices and the WY analogs in our next monthly report.

A Tale of Two Storms:
Comparing the November 19-23 and December 20-29 Events
To provide context, let’s examine the differences between these two significant events:
- Geography: The November event was concentrated in northern California, with CAP Regions 2 and 3 gaining over 15 percentage points. No Region1 data was available for the ad-hoc report, however Weather Tools’ monthly verification report revealed a 30-point jump in November. There was a considerable disparity in precipitation across Regions 2-6 during the November event, with a 14-point spread in accumulation from the highest value in Region 2 to the lowest in Regions 5 and 6. By contrast, the December event exhibited more uniform totals across Regions 2–6, with only a 5-point difference separating the highest value in Region 2 and the lowest in Region 5.
- Duration: The November event was short and intense, delivering precipitation in a quick burst. The December event lasted twice as long, driven by successive atmospheric rivers over an extended period.
- Magnitude: Both events produced similar increases in precipitation totals: 10 percentage points (Core) and 5 percentage points (State) in November, compared to 9 percentage points (Core) and 4.5 percentage points (State) in December.
