And We’re Off!
The 2025–26 water year is off to a running start. From mid-October through November, storms have already drenched much of the state, pushing nearly every region well above normal for this point in the season. Southern California has seen some of its wettest November conditions on record, while the Core Supply region is keeping pace with last year’s strong early-season totals.
Analog Comparison
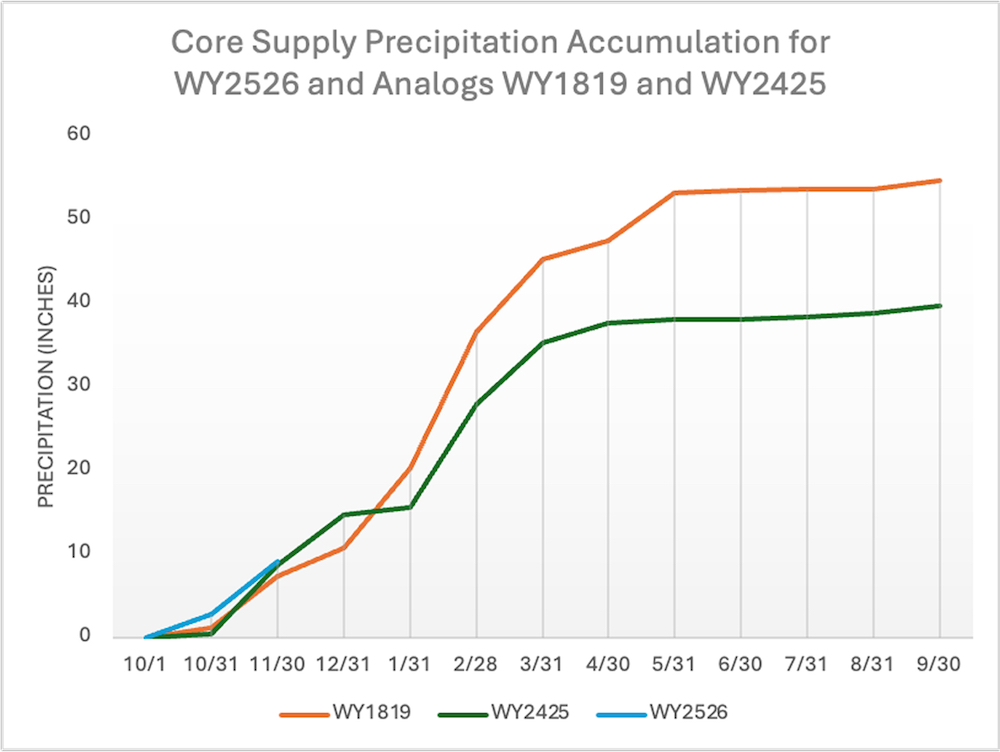
The image below features the Core Supply accumulation for analog water years 2018‑19 and 2024‑25 alongside the present year. Both analogs started the water year strong, and the current year is right on pace, with an accumulation for the Core Supply that is within 0.3 inches of last year’s total. This early-season surge is notable not only for its totals but also for their spatial pattern, with Southern California seeing some of the wettest November conditions on record while much of Northern California remains closer to average.
Spatial Comparison
California Water Watch (CWW) provides precipitation estimates utilizing PRISM (Parameter-elevation Regressions onIndependent Slopes Model) data. Developed by Oregon State University, PRISM data provides high-resolution spatial estimates of climate variables such as precipitation, temperature, and snowpack. For the purpose of visualizing precipitation patterns, the CWW map is particularly helpful; the image below shows the spatial distribution of precipitation through November 28, with the CAP regions overlaid. Precipitation statistics are adjacent, with PRISM estimates showing California at 152% of average through November 28, or 25% of average for the full water year.
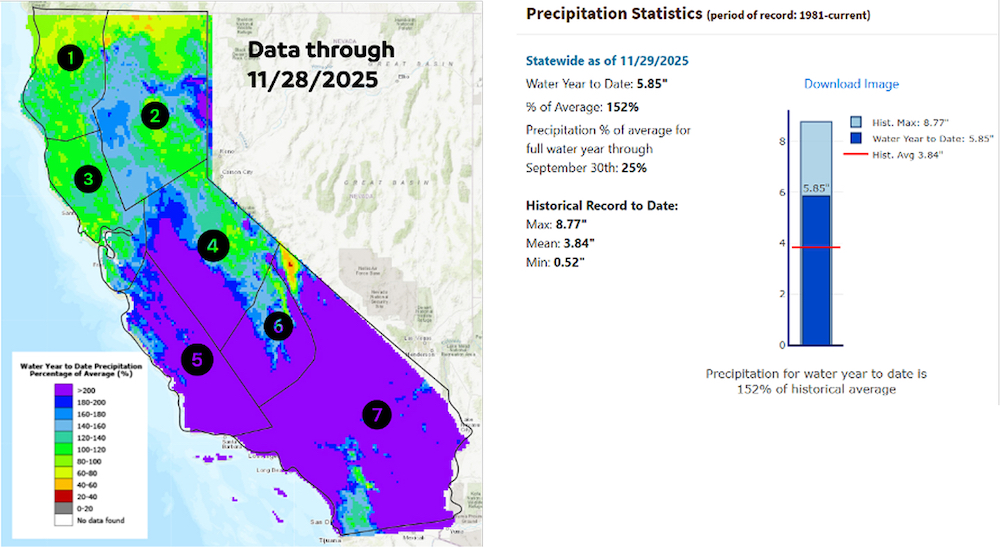
Nearly the entire state is well above normal for this point of in the season with only the northernmost areas dipping below 80% of normal. Much of Regions 5, 6, and 7 have exceeded 200% of average, making the first two months of the water year exceptional and geographically striking compared to WY 2024-25 (see discussion below).The orientation of early season storms in mid-October and mid-November has made this the wettest November on record for some portions of Southern California.
While the Core Supply accumulation this year mirrors WY 2024-25, the spatial pattern tells a different story. The CWW image below shows that as of November 28, 2024, precipitation was heaviest in Northern California, near average in the Central Sierra, and below 20% of normal for most of Southern California by this time last year.
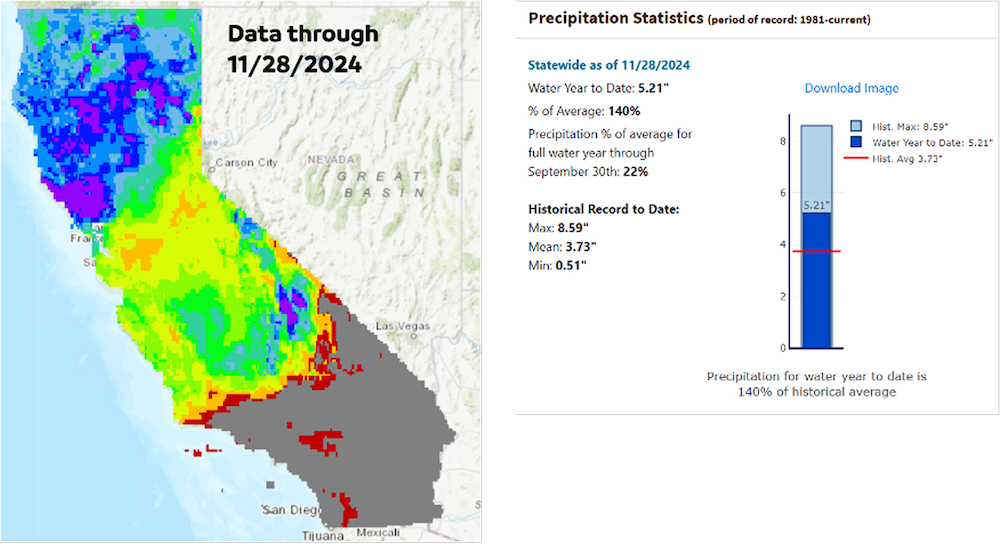
The adjacent PRISM statistics show that through November 28, 2024, the state as a whole sat at 140% of average to date, or 22% of average for the full water year. The totals were similar, but the distribution looked different from last year to this.
Looking Ahead
With the first two months of the water year already posting exceptional totals, California is off to a strong start. Southern California’s record-setting November, along with above-normal conditions across much of the Core Supply and other regions, sets the stage for a promising season. While plenty of the water year remains, these early gains provide a solid foundation for reservoirs and snowpack as we move into December and beyond.
