Ad Hoc Report: April Storm Recap
Note: What was previously referred to as CAP is now part of a broader forecasting framework called ALICE (Atmospheric Linkages Informing Community Expectations). For more information, see the blue “Introducing ALICE” box at the top of the portal dashboard.
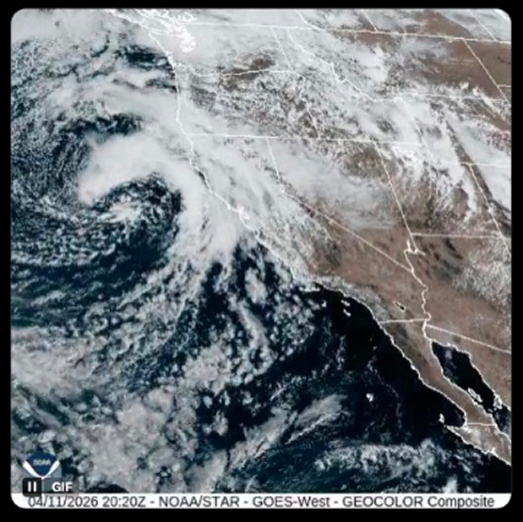
Satellite imagery (right) shows the low-pressure system off the coast of California that delivered a significant burst of precipitation to the state over the past week.
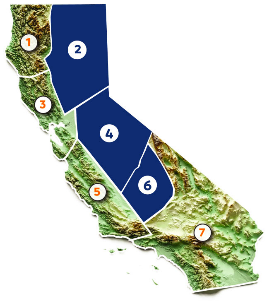
Let’s look at how this event impacted accumulation numbers for the Core Supply region (highlighted in blue on the California map below) and ALICE Regions 2, 3, 4, and 6, individually. Observed water year percentages include precipitation through April 13, 2026:
- Core Supply (Aggregate of Regions 2, 4, & 6): ALICE Forecast: 95–115%; Observed: 98.61% – verified
- Region 2: ALICE Forecast: 105–125%; Observed: 100.64%
- Region 3: ALICE Forecast: 100–120%; Observed: 101.3% – verified
- Region 4: ALICE Forecast: 92.5–112.5%; Observed: 95% – verified
- Region 6: ALICE Forecast: 87.5–107.5%; Observed: 100.25% – verified
April is clearly off to a very wet start. Our monthly report, released last week using data through April 6, already captured early-month gains. Over the past week alone, the Core Supply region added another 2.06 inches, bringing the April total to 3.2 inches—more than 35 times the total precipitation observed in March.
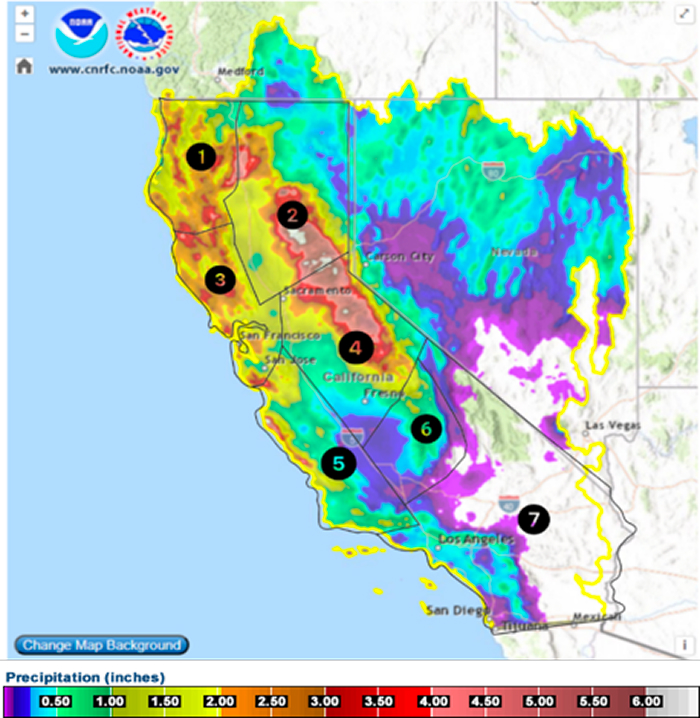
The adjacent map shows total observed precipitation over the past seven days (in inches), with ALICE Regions 1–7 overlaid. This product is generated by the California-Nevada River Forecast Center (CNRFC) and represents a blended analysis of radar data, rain gauge observations, and satellite inputs. These data are quality-controlled and combined into a gridded dataset, providing a spatially continuous depiction of where precipitation occurred and how much fell. Totals include liquid-equivalent precipitation, capturing both rainfall and snowfall.
Precipitation over the past seven days was heaviest across Northern California and along the Coastal Ranges and Sierra Nevada. Regions 1–3 received widespread moderate to heavy precipitation, generally in the 2–4+ inch range. Totals decreased into the Central Valley, where accumulations were lighter. In Region 4, valley totals remained modest, while mountain locations received upwards of 4 inches. In Region 6, precipitation was moderate overall, with locally higher amounts in terrain-favored areas.
Overall, this event provided a meaningful mid-spring boost to water year totals, particularly across Northern California and higher-elevation terrain.
